

Question: can someone help with these questions starting at e) Aggregate Expenditure and Equilibrium 1.500 1,400 1.300 @ e 46 ing AE 1200 The diagram to
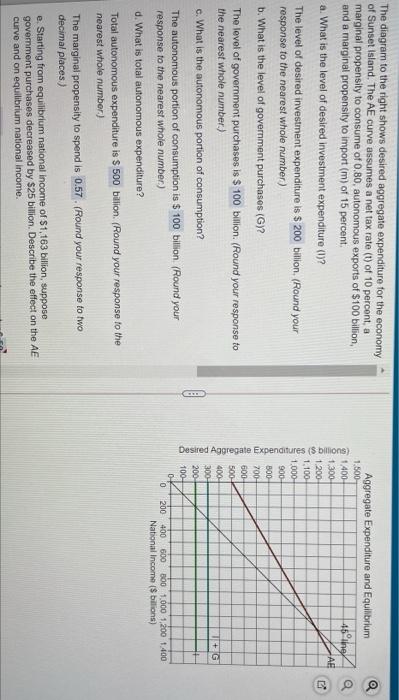
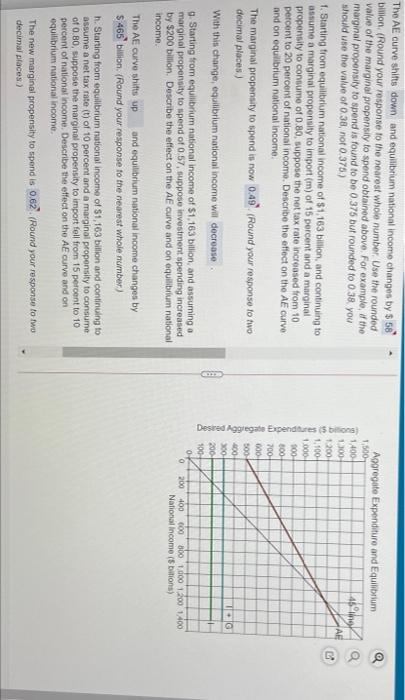
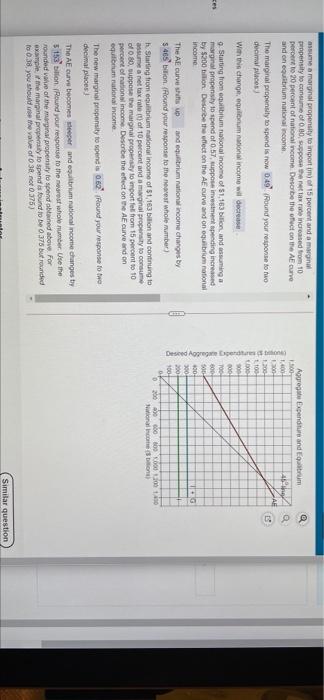
Aggregate Expenditure and Equilibrium 1.500 1,400 1.300 @ e 46 ing AE 1200 The diagram to the right shows desired aggregate expenditure for the economy of Sunset Island. The AE curve assumes a net tax rate (t) of 10 percent, a marginal propensity to consume of 0,80, autonomous exports of $100 billion and a marginal propensity to import (m) of 15 percent a. What is the level of desired investment expenditure (1)? The level of desired investment expenditure is $ 200 billion, (Round your response to the nearest whole number) b. What is the level of government purchases (Gy? The level of government purchases is $ 100 billion. (Round your response to the nearest whole number.) c. What is the autonomous portion of consumption? The autonomous portion of consumption is $ 100 billion (Round your response to the nearest whole number) d. What is total autonomous expenditure? Total autonomous expenditure is $ 500 billion (Round your response to the nearest whole number.) The marginal propensity to spend is 0.57. (Round your response to two decimal places) e. Starting from equilibrium national income of $1,163 billion, suppose government purchases decreased by $25 billion. Describe the effect on the AE curve and on equilibrium national income. Desired Aggregate Expenditures (8 billions) 1.100 1.000 900 800 700- 600 500 400 300 200 + G 100 0- 0 200 400 600 800 1.000 1.200 1400 National Income ($ bilions) Aggregate Expenditure and Equilibrium 1.500 1,400 45 ling 1100 AF 1.200 1.100 .000 500 100 700 Desired Aggregate Expenditures is on) The AE curve shifts down and equilibrium national income changes by $ 58 billion (Round your response to the nearest whole number. Use the rounded value of the marginal propensity to spend obtained above. For example, the marginal propensity to spend is found to be 0.375 but rounded to 0 38 you should use the value of 0.38, not 0.376) 1. Starting from equilibrium national income of $1,163 billion, and continuing to assume a marginal propensity to import (m) of 15 percent and a marginal propensity to consume of 0.80, suppose the net tax rate increased from 10 petcent to 20 percent of national income. Describe the effect on the AE curve and on equilibrium national income. The marginal propensity to spend is now 0:49(Round your response to two decimal places) With this change, equilibrium national income will decrease Starting from equilibrium national income of S1, 163 billion and assuming a marginal propensity to spend of 0.57, suppose investment spending increased by $200 billion Describe the effect on the AE curve and on equilibrium national income The AE curve shifts up and equilibrium national income changes by $ 465 billion (Round your response to the nearest whole number) h. Starting from equilibrium national income of $1,163 billion and continuing to assume a net tax rate (t) of 10 percent and a marginal propensity to consume of 0.80, suppose the marginal propensity to import fell from 15 percent to 10 percent of national income. Describe the effect on the AE curve and on equilibrium national income The new marginal propensity to spend is 0.62 (Round your response to two decimal places) 000 300 400 co 200 100 0 0 200 400 000 abo do 1200 1400 National income ( bilions) Aggregate Expenditure and East 500 oo assume a marginal propensity to import of 15 percent and a marginal propensity to consume 0.00, suppose the net tax rate increased from 10 percent to 20 percent of national income Describe the out on the AE curve and on equilibrium national income The marginal propensity to spend is now 0.40 Round you your response to ho decimales With this change, ogulinum national income will decrease Starting from equiblum nasional income of $1,163 bilion, and assuming a marginal propensity to spend of 0:57, suppose investment spending incre by $200 billion Describe the effect on the AE curve and on equilibrium national income too 000 Deseed Aggregate pentrs 300 700 300 1902 200 200 100 IN D 2000000 National com ) The AE curves up and equilibrium national income changes by $ 465 billion (Round yow response to the nearest whole number) h. Starting from equilibrium national income of $1,100 bilion and continuing to assume ant tax rate of 10 percent and a mwginal property to come of 80, suppose the marginal propisy to mport fell from 15 percent to 10 percent of national income Describe the effect on the AE curve and on equilibrium rational income The new marginal propensity to spend Round your response to twe decimal places The AE curve becomes weeper and equilibrium national income changes ty 5 15 billion Round your response to the nearest whole number. Use the Founded value of the marginal propensity to spend obtained above. For example, the marginal propensity to spend is found to be 0.375 burrounded to 0.38, you should use the value of 38 0.375) Similar
Step by Step Solution
There are 3 Steps involved in it

Get step-by-step solutions from verified subject matter experts