Question: Can someone please answer question #2 a-c, I can't figure out how the answers. 1. Lavare, located in the Chicago suburbs, is a major manufacturer
Can someone please answer question #2 a-c, I can't figure out how the answers.
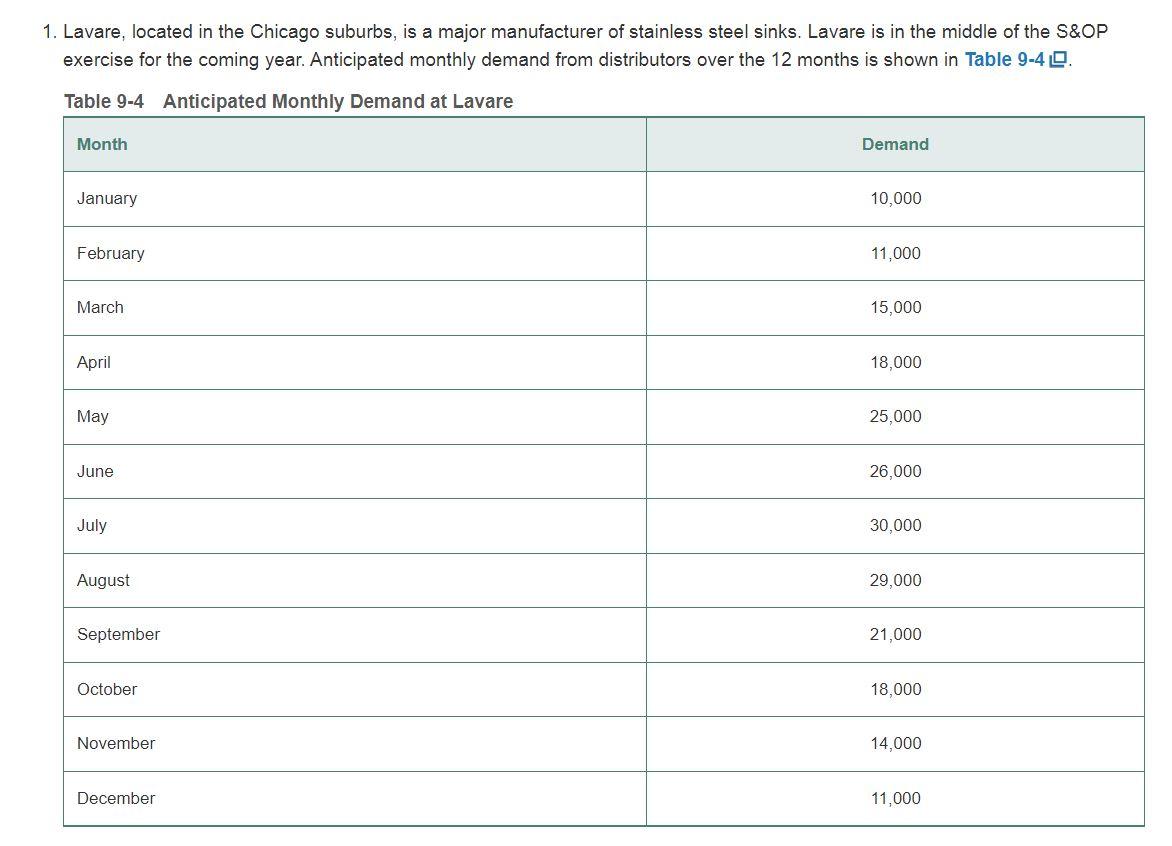
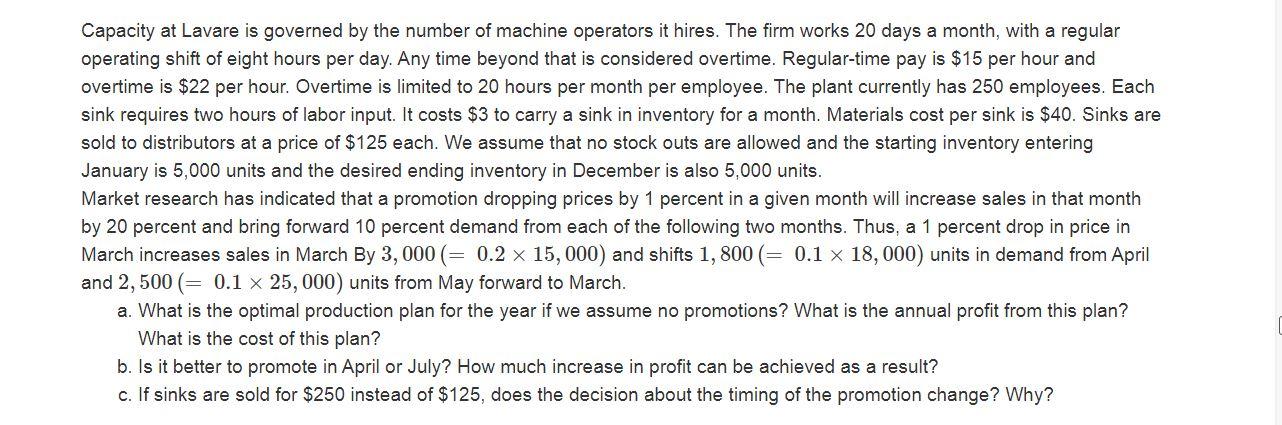
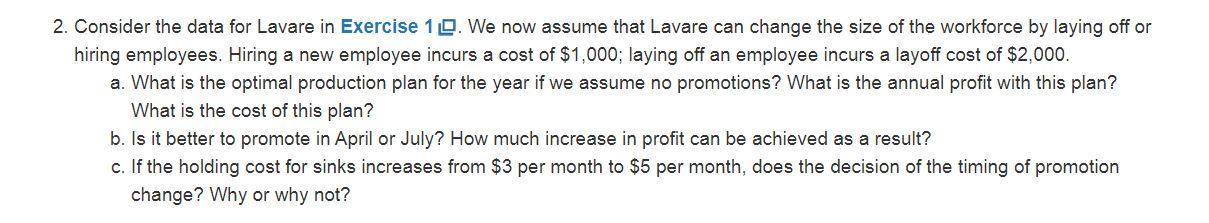
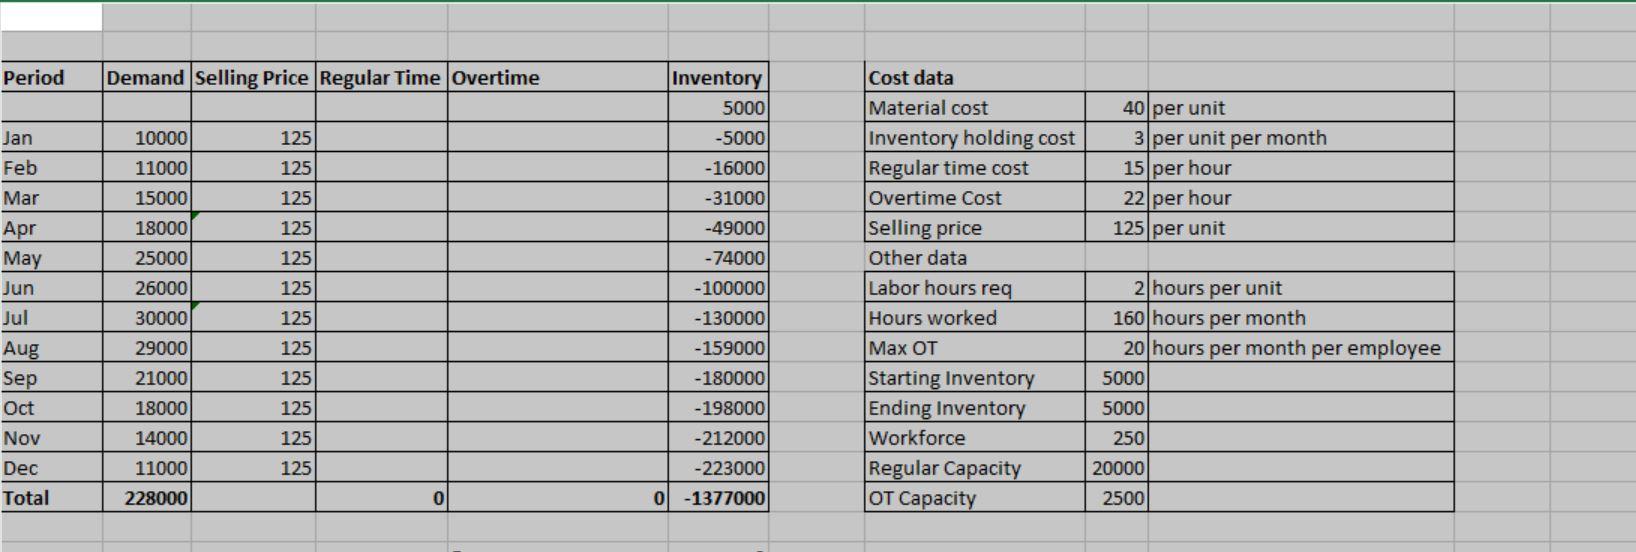

1. Lavare, located in the Chicago suburbs, is a major manufacturer of stainless steel sinks. Lavare is in the middle of the S&OP exercise for the coming year. Anticipated monthly demand from distributors over the 12 months is shown in Table 9-49. Table 9-4 Anticipated Monthly Demand at Lavare Month Demand January 10,000 February 11,000 March 15,000 April 18,000 May 25,000 June 26,000 July 30,000 August 29,000 September 21,000 October 18,000 November 14,000 December 11,000 Capacity at Lavare is governed by the number of machine operators it hires. The firm works 20 days a month, with a regular operating shift of eight hours per day. Any time beyond that is considered overtime. Regular-time pay is $15 per hour and overtime is $22 per hour. Overtime is limited to 20 hours per month per employee. The plant currently has 250 employees. Each sink requires two hours of labor input. It costs $3 to carry a sink in inventory for a month. Materials cost per sink is $40. Sinks are sold to distributors at a price of $125 each. We assume that no stock outs are allowed and the starting inventory entering January is 5,000 units and the desired ending inventory in December is also 5,000 units. Market research has indicated that a promotion dropping prices by 1 percent in a given month will increase sales in that month by 20 percent and bring forward 10 percent demand from each of the following two months. Thus, a 1 percent drop in price in March increases sales in March By 3,000 (= 0.2 x 15, 000) and shifts 1, 800 (= 0.1 x 18,000) units in demand from April and 2,500 (= 0.1 x 25,000) units from May forward to March. a. What is the optimal production plan for the year if we assume no promotions? What is the annual profit from this plan? What is the cost of this plan? b. Is it better to promote in April or July? How much increase in profit can be achieved as a result? c. If sinks are sold for $250 instead of $125, does the decision about the timing of the promotion change? Why? 2. Consider the data for Lavare in Exercise 19. We now assume that Lavare can change the size of the workforce by laying off or hiring employees. Hiring a new employee incurs a cost of $1,000; laying off an employee incurs a layoff cost of $2,000. a. What is the optimal production plan for the year if we assume no promotions? What is the annual profit with this plan? What is the cost of this plan? b. Is it better to promote in April or July? How much increase in profit can be achieved as a result? c. If the holding cost for sinks increases from $3 per month to $5 per month, does the decision of the timing of promotion change? Why or why not? Period Demand Selling Price Regular Time Overtime Cost data Inventory 5000 10000 125 -5000 Jan Feb 125 11000 15000 40 per unit 3 per unit per month 15 per hour 22 per hour 125 per unit Mar - 16000 -31000 -49000 125 18000 125 25000 125 - 74000 125 26000 30000 - 100000 - 130000 - 159000 125 Material cost Inventory holding cost Regular time cost Overtime Cost Selling price Other data Labor hours req Hours worked Max OT Starting Inventory Ending Inventory Workforce Regular Capacity OT Capacity Apr May Jun Jul Aug Sep Oct Nov Dec Total 2 hours per unit 160 hours per month 20 hours per month per employee 5000 29000 125 21000 125 - 180000 125 18000 14000 -198000 -212000 5000 2501 125 125 -223000 11000 228000 20000 2500 0 0 - 1377000 0 0 Promotion in April Promotion in July 0 Revenue Material Cost Regular time cost OT cost Inventory holding cost Total cost Total Profit 0 -4131000 -4131000 4131000


