

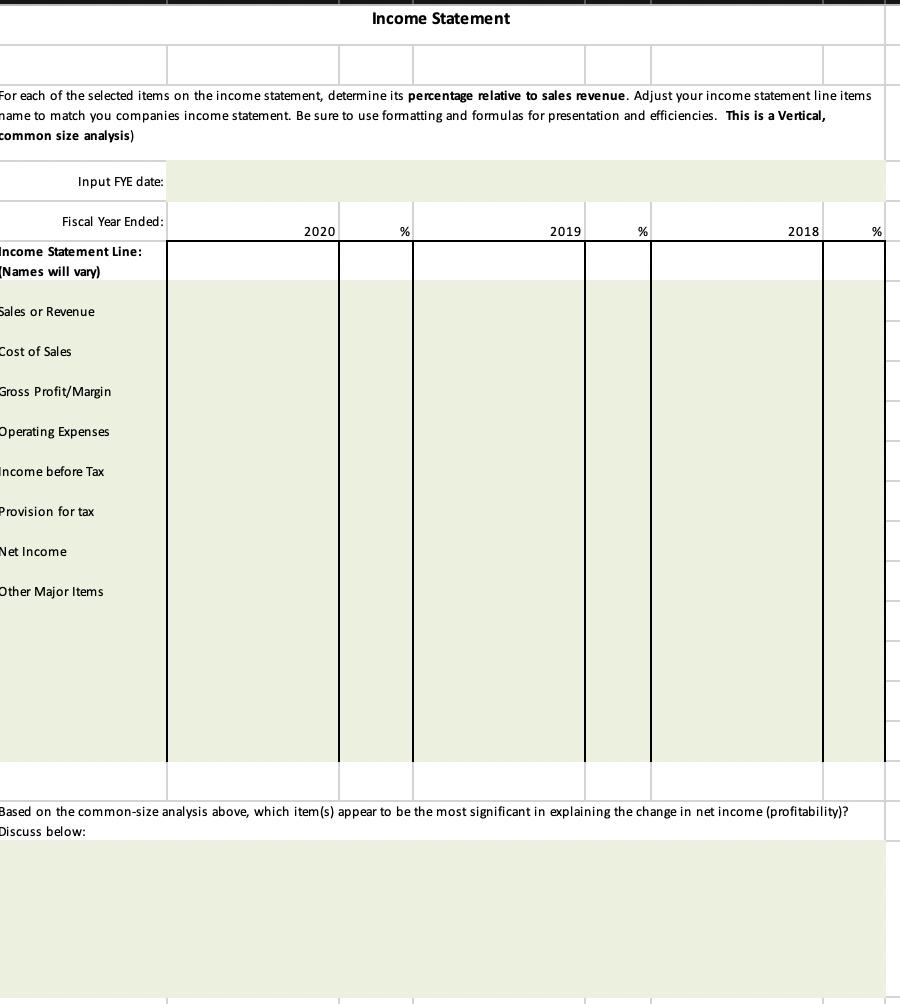
Find the most recent 10k (annual report filed with the SEC) for your chosen company Update...
Fantastic news! We've Found the answer you've been seeking!
Question:
Transcribed Image Text:
Find the most recent 10k (annual report filed with the SEC) for your chosen company Update the project spreadsheet so the headings (the dates on the columns) represent the most recent years that annual financial information is available for your company Search the 10K for the information you need to complete the Excel project spreadsheet. You will need to carefully review the 10k including the written company highlights and financial notes to find the necessary information, you will need to do calculations, you will need to provide additional competitive ratios (from other groups in the class, or by reviewing another companies 10K information from the Edgar database). You may need to review a prior years 10K to find all the information that you need. Your company may have more or fewer rows than what is listed in the spreadsheet template. I recommend consolidating financial information where reasonable and adding rows where required. Assume that you are my accounting analyst - and are summarizing the required information for senior management. Your balance sheet should balance! For each of the selected items on the income statement, determine its percentage relative to sales revenue. Adjust your income statement line items name to match you companies income statement. Be sure to use formatting and formulas for presentation and efficiencies. This is a Vertical, common size analysis) Fiscal Year Ended: Input FYE date: Income Statement Line: Names will vary) Sales or Revenue Cost of Sales Gross Profit/Margin Operating Expenses Income before Tax Provision for tax Net Income Other Major Items. Income Statement 2020 % 2019 % 2018 Based on the common-size analysis above, which item(s) appear to be the most significant in explaining the change in net income (profitability)? Discuss below: % NOTES TO CONSOLIDATED FINANCIAL STATEMENTS Summary of Significant Accounting Policies Inventories Note 1 Note 2 Note 3 Note 4 Note 5 Note 6 Note 7 Note 8 Note 9 Note 10 Note 11 Note 12 Note 13 Note 14 Note 15 Note 16 Note 17 Note 18 Note 19 Note 20 Note 21 Property, Plant and Equipment Identifiable Intangible Assets and Goodwill Accrued Liabilities Fair Value Measurements Short-Term Borrowings and Credit Lines Long-Term Debt Income Taxes Redeemable Preferred Stock Common Stock and Stock-Based Compensation Earnings Per Share Benefit Plans Risk Management and Derivatives Accumulated Other Comprehensive Income (Loss) Revenues Operating Segments and Related Information Commitments and Contingencies Leases Acquisitions and Divestitures Subsequent Events 62 69 69 69 70 70 73 74 75 78 78 80 80 81 86 88 89 92 92 93 94 2020 FORM 10-K 61 Wars! ASSETS Current assets Cash and equivalents Short-term investments Accounts rccolvable, not inventories Prepaid expenses and other current assets Total current s Property, plant and equipment, not Operating less right-of-use assets.net centMabic angible assets, not Goodwill Deferred income taxes and other assets TOTAL ASSETS LIABILITIES AND SHAREHOLDERS' EQUITY Current liablitics: Current portion of long-term debt Notes payable Accounts payable Current portion of operating lease labilbes Accrued liabilities Income taxes payable Total current liabilities Long-tam deb Operating lease liabilities Deferred income taxes and other labies an Commitments and contingendes (Noto 18) Redeemable preferred stock Shareholders' equity Comman stack at stated value: Class A convertibre-315 and 315 shares outstanding Class B-1,243 and 1,253 shares outstanding Capital in excess of stated value Accumulated other comprehensive Incoma loas) Retained eaminge (deficit) Total shareholders' culty TOTAL LIABILITIES AND SHAREHOLDERS' EQUITY $ $ $ $ 2020 8,348 4:39 2,749 7.367 1.663 20.506 4,866 3.097 274 223 2,326 31.342 3 248 2.248 445 5.184 156 8.224 9,406 2.913 2,684 3 3 8.299 (56) (191) $ $ $ 8,065 31.342 $ 2019 4,465 197 4,272 5,622 1,968 16,525 4,744 283 154 2,011 23,717 5 9 9 2,612 5,010 229 7,955 3,464 3,347 = 7,163 231 1,643 9,040 23,717 Net income Adjustments to reconcic net income to net cash provided (used) by operations: Decrecision Deferred income taxes Stock-based compensation Amortization, impairment and other Net foreign cumarcy adjustments Changes in certain working capital components and other assets and liabilities: (Inca) decrease in accounts receivable increase) decrease in invertones (Incen) decrease in prepaid expansak, operating kase right-of-use assets and other current and non-current sasats Increase (decrease) in accounts payable accrued liabilities, operating lease labines and other current and non-current liabilities Cash provided (used) by operations Cash provided lused) by investing activities: Purchases of short-term invalments. Matunities of short-term investments Sales of short-term investments Additions to property, plant and equipment Other investing activities Cash provided (used) by investing activities Cash provided (used) by financing activities: Proceeds from borrowings, net of debt issuance costs Increase (decrease) in notas payabla, nat Proceeds from exercise of stock options and other stock issuances Repurchase of common stock Dividends-common and preferred Other financing activities Cash provided (sed) by firencing activities Effect of exchange rate changes on cash and coulvakonts Net intresse (decrease) in cash and equivalenx Cash and equivalents, beginning of year CASH AND EQUIVALENTS, END OF YEAR Supplemental disclosure of cash flow information Cash paid during the year for Interest, net of capitalized interest Income taxes Non-cash additions to property plant and equipment Dividends declared and not paid $ $ 2.539 $ 721 (380) 429 398 23 1,239 1,854 (854) 24 2,485 12,4261 74 2,379 1,085 31 (1,025) 6,134 49 885 13.087) 11,452) (58) 2,491 1651 3.002 4,465 8,348 $ 140 $ 1,025 121 395 3 ***-* 50083 3¤¤€˜008¶¶§€733 P*** 4,029 $ 4,466 $ 153 $ - કાજી | Lal | Tet g sle Fo||RS & 11,028) 11,243 Table of Contents NIKE, INC. CONSOLIDATED STATEMENTS OF COMPREHENSIVE INCOME (Dollars in millions) Net income Other comprehensive income (loss), net of tax: Change in net foreign currency translation adjustment Change in net gains (losses) on cash flow hedges Change in net gains (losses) on other Total other comprehensive income (loss), net of tax TOTAL COMPREHENSIVE INCOME The accompanying Notes to the Consolidated Financial Statements are an integral part of this statement. $ $ 2020 2,539 $ (148) (130) (9) (287) 2,252 $ YEAR ENDED MAY 31, 2019 4,029 (173) 503 (7) 323 4,352 $ $ 2018 1,933 (6) 76 34 104 2,037 CONSOLIDATED STATEMENTS OF SHAREHOLDERS' EQUITY to store detal Balance at May 31, 2017 Stack options exercised Repurchase of Class B Common Stock Dividends on common stock (50.78 per share) and preferred stock (50.10 per share) Issuance of shares to employees, net of shares withheld for employee taxes Stock-based compensation Net income Other comprehensive income Bloss) Reclasstications to retained earnings in accordance with ASU 2018-02 Balance at May 31, 2018 Stock options exercised Conversion to Class B Common Stock Repurchase of Class B Common Stock Dividends on common stock (50.86 per share) and preferred stock (50.10 per share) Issuance of shares to employees, net of shares with held for employee taxes Stock-based compensation Net Income Other comprehensive income (ass) Adoption of ASU 2015-16 (Note 11 Adoption of ASC Topic 606 (Nota 1) Balance at May 31, 2019 Stack options axercised Repurchase of Class B Common Stock Dividends on common stock (50.955 per share) and preferred stock (50.10 per share) Issuance of shares to employees, net of shares with held for employee taxes Stock-based compansation Net Income Other comprehensive income (loss) Adoption of ASC Toplo 842 (Nete 11 Balance at May 31, 2020 CLASS A SHARES 329 $ 329 $ 315 $ $ 315 $ COMMON STOCK AMOUNT SHARES 1,314 $ 24 (70) CLASS B 4 1,272 18 14 3 1,253 20 (34) 4 S $ 1.243 S AMOUNT 3 $ 3 $ 3 $ 3 $ CAPITAL IN EXCESS OF STATED VALUE 5,710 800 (254) 110 218 8,384 539 12271 142 325 7,163 703 11611 165 4:29 ACCUMULATED OTHER COMPREHENSIVE INCOME (LOSS) $ S S S 8,299 S (213) $ 104 17 192) S 323 231 (267) $ 156) $ RETAINED EARNINGS (DEFICIT) 6,907 $ (4.013) (1265) 1.933 (17) 3.517 S (4.066) (1.360) (3) 4.029 (607) 23 1.643 $ (2.872) (1.491) (9) 2.539 (1) (191) $ TOTAL 12,407 800 (4,257 11,2685; 82 218 1,933 104 9,812 539 (4,283) 11.3801 139 325 4,029 323 (507) 23 9,040 703 13,033) 11.491) 150 429 2,539 (287) (1) 8,055 NOTE 6 - FAIR VALUE MEASUREMENTS ► The following tables present information about the Company's financial assets measured at fair value on a recurring basis as of May 31, 2020 and 2019 and indicate the level in the fair value hierarchy in which the Company classifies the fair value measurement. Refer to Nata 1-Summary of Significant Accounting Policies for accions dels regarding the Company's Sir valus measurement methodology Min Cash Level 1: U.S. Treasury securties Level 2: Commercial paper and bonds Money market funds Time deposits US Agency securities Total Level 2 TOTAL 2020 FORM 10-K 70 Table of Contents (Donos Cash Level 1: U.S. Treasury secuies Level 2: Commercial paper and bonds Money market funds Time deposits U.S. Agency securities Total Level 2 TOTAL $ 5 $ 5 ASSETS AT FAIR VALUE 596 S $ 1.204 32 5.973 981 7 6.987 8,787 ASSETS AT FAIR VALUE 853 $ 347 $ 34 1.637 1.791 3.463 4,883 S $ MAY 31, 2020 CASH AND EQUIVALENTS MAY 31, 2019 606 $ 800 = 5,573 979 6.962 8,348 $ CASH AND EQUIVALENTS 853 $ 200 1 1.637 1.775 3,413 4.488 5 $ SHORT-TERM INVESTMENTS 404 As of May 31, 2020, the Company held $396 milion of available-for-sale debt securities with maturity dates within one year and $43 million with maturity dates over one year and less than five years in Short-term investments on the Consolidated Balance Sheets. The fair value of the Company's available-for-sale debt secu accroximates their amortized cost 32 2 1 35 439 SHORT-TERM INVESTMENTS 147 33 15 1 50 197 GROSS MARGIN FISCAL 2020 COMPARED TO FISCAL 2019 For fiscal 2020, our consolidated gross profit decreased 7% to $16.241 million compared to $17,474 million for fiscal 2019, which was significantly impacted by lower shipments to our wholesale customers and store closures within our NIKE Direct operations due to COVID-19. Gross margin decreased 130 basis points to 43.4% for fiscal 2020 compared to 44.7% for fiscal 2019 due to the following 1.5 (1.4) 44 42 44.7 TIE NEBRAND KEBANG MERAZE SELLING PRACTCOSTS PRETO INTERN in Demand creation experse11 Operating overhead expense Total saling and administrative expense % of revenues (0,40 L FORD CURRENCY AGE RATES HEDGES 0.2 D Other income) uspense, nel OFF-PROP (0.1) HAT DERET (1.1) NE OTHER COSTS 43.4 W! Higher product costs were in part due to increments tarifs in North America. Higher other coets, primarily in the fourth quarter of fiscal 2020 due to the impacts of COVID-19. were specifically related to increased factory cancellations coets higher inventory obsolescence and the adverse rate impact of supply chain costs on a lower volume of wholesale shipments TOTAL SELLING AND ADMINISTRATIVE EXPENSE P 3 FISCAL 2020 $ FISCAL 2019 3.502 S $ 9534 13.126 S $ 36.1 % Demand se can afscharthing was presenten czateng ab of conte, complay procker aber chaand prot meventing and manaf ala branat prost FISCAL 2020 COMPARED TO FISCAL 2019 Domand creation expense decreased 4% for fiscal 2020 compared to fiscal 2019, due to lower retall brand presentation costs and lower sports marketing investments, as well as decreased advertising and marketing expenses as sporting events were postponed or canceled and a majority of stores were closed globally during the fourth quarter of facal 2020. The decreases were partially offset by higher digital brand marketing costs. Changes in foreign cumancy exchange rates decreased Demand creation expansa by approximately 2 percentage points for facal 2020 % CHANGE 3,753 8,949 12,702 32.5% -4% 3 7% 3% 3 FISCAL 2020 FISCAL 2018 260 bps 3.577 7,934 11,511 FISCAL 2019 % CHANGE 31.6% Operating overhead expense increased 7% for fiscal 2020 compared to fiscal 2019, driven by higher wage-related and administrative expenses to support our continued investments in end-to-end digital capabilities, including support for a new enterprise resource planning tool Operating overhead expense was further impacted by higher bad debt expense recognized during the fourth quarter of fiscal 2020 due to the impacts of COVID-19. These increases were partially offset by lower travel and related spend. Changes in foreign currency exchange rates decreased Operating overead expanse by approximately 1 percentage points for fiscal 2020. OTHER (INCOME) EXPENSE, NET 5% 13% 10% 90 bps FISCAL 2018 139 $ (78) $ 66 Omar (income) expense, not comprises foreign currency conversion gains and losses from the re-measurement of manetary assets and liabilties denominated in non-functional currencies and the impact of certain foreign currency derivative Instruments, as well as unusual or non-operating transactions that are outside the normal course of business NOTE 4 - IDENTIFIABLE INTANGIBLE ASSETS AND GOODWILL Identifiable intangible assets, net consist of indefinite-lived trademarks, acquired trademarks and other intangible assets. The following table summarizes the Company's Identifiable intangible assets, net balances as of May 31, 2020 and 2019: (Dollars in millions) Indefinite-lived trademarks $ GROSS CARRYING AMOUNT 246 47 293 2020 ACCUMULATED AMORTIZATION $ - 19 19 $ NET CARRYING AMOUNT 246 28 274 $ MAY 31, $ GROSS CARRYING 2019 AMOUNT ACCUMULATED AMORTIZATION 281 $ 22 303 $ Acquired trademarks and other $ $ $ IDENTIFIABLE INTANGIBLE ASSETS, NET Goodwill was $223 million and $154 million at May 31, 2020 and 2019, respectively and there were no accumulated impairment losses as of May 31, 2020 and 2019. Additionally, the impact to Goodwill during fiscal 2020 and 2019 as a result of acquisitions and divestitures was not material. - 20 20 $ $ NET CARRYING AMOUNT 281 2 283 INCOME TAXES FISCAL 2020 12.1% FISCAL 2019 16.1% % CHANGE (400) bps FISCAL 2018 55.3% Effective tax rate FISCAL 2020 COMPARED TO FISCAL 2019 Our effective tax rate was 12.1% for fiscal 2020, compared to 16.1% for fiscal 2019 due to increased benefits from discrete items such as stock-based compensation. Our effective tax rate for fiscal 2018 reflected significant changes related to the enactment of the U.S. Tax Cuts and Jobs Act (the "Tax Act"). Refer to Note 9 Income Taxes in the accompanying Notes to the Consolidated Financial Statements for additional information on the impact of the Tax Act. % CHANGE (3,920) bps NOTE 2 - INVENTORIES Inventory balances of $7,367 million and $5,622 million at May 31, 2020 and 2019, respectively, were substantially all finished goods. NOTE 3 — | Property, plant and equipment, net included the following: (Dollars in millions) Land and improvements PROPERTY, PLANT AND EQUIPMENT Buildings Machinery and equipment Internal-use software Leasehold improvements Construction in process I Total property, plant and equipment, gross Less accumulated depreciation TOTAL PROPERTY, PLANT AND EQUIPMENT, NET Capitalized interest was not material for the years ended May 31, 2020, 2019 and 2018. $ $ 2020 MAY 31, 345 2,442 2,751 1,483 1,554 1,086 9,661 4,795 4,866 $ $ 2019 329 2,445 2,726 1,609 1,563 797 9,469 4,725 4,744 SELECTED QUARTERLY FINANCIAL DATA (UNAUDITED) (In millions, except per share data) Revenues(1) Gross profit Gross margin(1) Net income (loss)(1) Earnings (loss) per common share: Basic Diluted Weighted average common shares outstanding Diluted weighted average common shares outstanding Cash dividends declared per common share $ 1ST QUARTER 2020 10,660 $ 4,871 45.7% 1,367 0.87 0.86 1,562.4 1,597.5 2019 9,948 4,397 44.2% 1,092 0.69 0.67 1,594.0 1,634.4 $ 2ND QUARTER 2020 10,326 $ 4,544 44.0% 1,115 0.71 0.70 1,560.6 1,594.4 2019 9,374 $ 4,105 43.8% 847 0.54 0.52 1,581.4 1,620.7 3RD QUARTER 2020 10,104 $ 4,473 44.3% 847 0.54 0.53 1,556.3 1,591.6 2019 9,611 4,339 45.1 % 1,101 0.70 0.68 1,572.8 1,609.6 $ 4TH QUARTER 2020 6,313 $ 2,353 37.3% (790) (0.51) (0.51) 1,555.7 1,555.7 2019 10,184 4,633 45.5% 989 0.63 0.62 1,570.2 1,607.5 0.22 0.20 0.245 0.22 0.245 0.22 0.245 0.22 (1) The third and fourth quarters of fiscal 2020 reflect the impacts of COVID-19 on our results of operations and financial condition. Refer to Item 7. Management's Discussion and Analysis of Financial Condition and Results of Operations for additional information. RESULTS OF OPERATIONS (Dollars in millions, except per share data) Revenues(1) Cost of sales Gross profit Gross margin(1) Demand creation expense Operating overhead expense Total selling and administrative expense % of revenues Interest expense (income), net Other (income) expense, net Income before income taxes Income tax expense(2) Effective tax rate $ $ $ FISCAL 2020 37,403 $ 21,162 16,241 43.4% 3,592 9,534 13,126 35.1% 89 139 2,887 348 12.1% 2,539 1.60 $ $ FISCAL 2019 39,117 21,643 17,474 44.7% 3,753 8,949 12,702 32.5% 49 (78) NET INCOME(1) Diluted earnings per common share (1) Fiscal 2020 reflects the impacts of COVID-19 on our results of operations. Refer to discussion of our results below for additional information. (2) Fiscal 2018 reflects the impact from the enactment of the U.S. Tax Cuts and Jobs Act. Refer to Note 9 Income Taxes in the accompanying Notes to the Consolidated Financial Statements for additional information. 4,801 772 16.1% 4,029 2.49 % CHANGE -4 % $ -2% -7% -4% 7% 3% -40% -55 % -37% $ -36% $ FISCAL 2018 36,397 20,441 15,956 43.8% 3,577 7,934 11,511 31.6% 54 66 4,325 2,392 55.3% 1,933 1.17 % CHANGE 7% 6% 10% 5% 13% 10% 11% -68 % 108 % 113 % REVENUES Coas NIKE, Inc. Revenues: NIKE Brand Revenues by: Footw Apparel Equipment Global Brand Division Total NIKE Brand Revenues Converse Corporate TOTAL NIKE, INC. REVENUES Supplemental NIKE Brand Revenues Details: NIKE Brand Revenues by: Sales to Wholesale Customers Sales through NIKE Direct Global Brand Divisional TOTAL NIKE BRAND REVENUES NIKE Brand Revenues on a Wholesale Equivalent Basis) Sales to Wholas Customers Sales from our Whoksaa Operations to NIKE Direct Operations TOTAL NIKE BRAND WHOLESALE EQUIVALENT REVENUES NIKE Brand Wholesale Equivalent Revenues by:11) Men's Women's NIKE Kids Other TOTAL NIKE BRAND WHOLESALE EQUIVALENT REVENUES NIKE Brand Wholesale Equivalent Revenues by:1¹) Running NIKE Basketbal Jorcan Brand Football (eccer) Training Sporzs $ --- - $ $ FISCAL 2020 $ SofM-GAAP Fec 23,305 10,953 1,280 30 35,568 1,845 S (11) 37,403 $ 23,156 S 12,382 30 35,568 S $ S 23,156 s 7,452 30,60B S 16.684 S 6,999 5.033 1,882 30.608 S 3,830 S 1,509 3.609 FISCAL 2019 1,575 2,888 12,285 5,113 30.608 S foarte tation 24,222 11,550 1,404 42 37,218 1,906 (7) 39,117 25,423 11.753 42 37,218 25,423 7,127 32,550 17,737 7,380 5.283 2,150 32,550 4,488 1,597 3,138 1,094 3.137 12.442 5,854 32,550 % CHANGE -4% -5% -9% -29% 4% -3% - -4% -9% 5% -29% -0% 5% -6% 5% -5% -5% -12% -6% -15% 5% 15% -17% -14% -1% -13% -6% Other TOTAL NIKE BRAND WHOLESALE EQUIVALENT REVENUES The peat change cu cuency changes and the son of a momeet-GAAP (2) Guess prato KE era ang bawal are not sofa geograpat uporakingga! Carpacaso revenues priory concior of fage surassy hago game and looses related to generated by ass who E Brand googrows opged Covero dut managed trough our cerealforej dekagerist management program % CHANGE EXCLUDING CURRENCY CHANGES -2% 3 -3% -8% -25% -2% -1% -2% $ -7% $ 8% -25% -2% $ -7% $ 7% -4% 5 4% $ -3% -3% -10% -4% $ 12% $ 4% 15% -14% -13% 1% -10% -4% $ FISCAL 2018 22,288 10,733 1,396 88 34,485 1,895 25 36,397 23,969 10,428 89 34,485 23,969 6,332 30,301 10,690 6,813 4.906 1,784 30,301 4,495 1,494 2,858 2,145 3,126 10,720 5483 30,301 % CHANGE 9 % 8% 1 % -52 % 8 % 1 % 7% 6% "ר. 13 % -52 % A% 13 % 7% 6% 7% 8% 21 % 7% ON 7% 2 10 % -12 % 0% 18 % 7% 7% % CHANCE EXCLUDING CURRENCY CHANGES!! 12 % 11 % 4 % -63 % 11 % 3% 11 % 10 % 16 % -63 % 11 % 10 % 16 % 11 % 10% 11 % 11 % 25 % 11 % 4% 9 % 12 % -6% 3% 21 % 9% 11 % ↑ The breakdown of revenues is as follows: (Dollars in millions) North America Europe, Middle East & Africa Greater China Asia Pacific & Latin America Global Brand Divisions(2) TOTAL NIKE BRAND Converse Corporate(3) $ Europe, Middle East & Africa Greater China FISCAL 2020 $ Asia Pacific & Latin America Global Brand Divisions TOTAL NIKE BRAND(1) Converse Corporate TOTAL NIKE, INC. EARNINGS BEFORE INTEREST AND TAXES(1) Interest expense (income), net TOTAL NIKE, INC. INCOME BEFORE INCOME TAXES (1) Total NIKE Brand EBIT and Total NIKE, Inc. EBIT represent non-GAAP financial measures. See "Use of Non-GAAP Financial Measures" for further information. 14,484 9,347 6,679 5,028 $ 30 35,568 1,846 (11) 37,403 $ $ FISCAL 2019 FISCAL 2020 TOTAL NIKE, INC. REVENUES $ (1) The percent change excluding currency changes represents a non-GAAP financial measure. See "Use of Non-GAAP Financial Measures" for further information. (2) Global Brand Divisions revenues are primarily attributable to NIKE Brand licensing businesses that are not part of a geographic operating segment. (3) Corporate revenues primarily consist of foreign currency hedge gains and losses related to revenues generated by entities within the NIKE Brand geographic operating segments and Converse, but managed through our central foreign exchange risk management program. The primary financial measure used by the Company to evaluate performance of individual operating segments is EBIT, which represents Net income before Interest expense (income), net and Income tax expense in the Consolidated Statements of Income. As discussed in Note 17- Information in the accompanying Notes to the Consolidated Financial Statements, certain corporate costs are not included in EBIT of our operating segments. The breakdown of earnings before interest and taxes is as follows: (Dollars in millions) North America 2,899 1,541 2,490 1,184 (3,468) 4,646 15,902 9,812 6,208 5,254 42 37,218 1,906 297 (1,967) 2,976 89 2,887 39,117 (7) $ $ % CHANGE -9% -5% 8% -4% -29% -4% -3% FISCAL 2019 -4% % CHANGE EXCLUDING CURRENCY CHANGES(1) 3,925 1,995 2,376 1,323 (3,262) 6,357 303 (1,810) 4,850 49 4,801 -9% $ -1 % 11% 1% -26% -2% -1% -2% $ FISCAL 2018 % CHANGE -26% $ -23% 5% -11% -6 % -27% -2% -9% -39% -40% 14,855 9,242 5,134 5,166 88 34,485 1,886 26 36,397 $ FISCAL 2018 % CHANGE 7% 6% 21% 2% -52 % 8% 1% 3,600 1,587 1,807 1,189 (2,658) 5,525 310 (1,456) 4,379 54 4,325 7% % CHANGE EXCLUDING CURRENCY CHANGES(1) Operating Segments and Related 7% 11 % 24% 13% -53 % 11% 3% 11% % CHANGE 9% 26 % 31% 11% -23% 15% -2% -24% 11% 11 % OFF-BALANCE SHEET ARRANGEMENTS In connection with various contrads and agreements we routinely provide indemnification relating to the enforceability of intelectual property rights, coverage for legal issues that arise and other iteme where we are acting as the guarantor. Currently, we have several such agreements in place. Based on our historical experience and the estimated probability of future loss, we have determined that the fair value of such incemnification is not material to our financial position or results of operations. CONTRACTUAL OBLIGATIONS Our significant long-term contractual obligations of May 31, 2020, and significant endorsement contracts, including related marketing commitments, entered into through the date of this report are sa loikowa: DESCRIPTION OF COMMITMENT Ded Operating Lesses Long-Term Deb Endorsement Contract21 Product Purchase Obligations Other Purwaa Obligadona) Transition Tax Related to the Tax Act TOTAL Table of Contents 3 123 14 5 2021 550 $ 289 1,330 4.234 1,085 86 7,574 S 2022 514 S 288 1471 345 26 2,702 $ CASH PAYMENTS DUE DURING THE YEAR ENDING MAY 31, 2023 2024 2025 156 $ 788 1,178 180 86 2,695 $ 416 S 275 1,064 <- - 2,052 S and The aparate de Ar knyg-debate of paymenteradorastenagamint azokoratyvareofy 31, 2020, nga bu for wabament corresterpass approaste of ORDONANÍ AKI FUNT wanywa mare obligated to pay alsak, potes igua, portando as of our products. Act and as a constatay be trghar han chu 138 161 374 3 1,275 1,135 - 127 215 3,126 5 bas THEREAFTER 1,474 3 11,541 3184 $ - 345 268 16,792 $ TOTAL tort pa a att ha ow conta prowl for bossases to be part to the anche bassapon beachar on prockets are parte. Achapas och some chats may abo de ras those casas ble prova foduced pagmente ale pemance de sch vi nch payments as an ato pverite vas not poslendeve spend on this move on natru a a the acts protect of cheap an the product. The amount of producted to the chowan my fan con the branding new they panduan de gardigandingkation, the conte i deg, de and puchon the potete fted in the endexare ced curand of cry fracid cynchtete cued fr er product a four mon based primary rackard credeam whose cars and demas com our direct de convergence for product pero congadbro raprasane agroasanta cat open purchase ora lo purchase produce he orary coace of an and bay arong and typese, possuto change troughout the prote and assesse et abors conducta, mada é de ordinary cow of business Toursors de santan papowtarqawwalby bylydning us Ropretro cast paymes ale as part of the ono os dono pasiason of indistato narasgo of Rugn satokkares www is rostos not of foreign to oredowed Roky 10 Moto9 Too in tamang Notes to the Consoldred Fisch In addition to the above, we have long term obligations for uncertain tax positions and various post retirement benefits for which we are not able to reasonably estimate when cash payments will cocur. Refer to Note 9 Income Taxes and Note 13-Benett Plans in the accompanying Notes to the Consolidated Financial Statements for further information related to uncertain tax positions and post-ratiramas benafts, respectively auguhnu primary sources and any conversa aruding prod. and woments that any al ajrakurs' Avera, and may inche pas pushasa waara for non- for donanmasion. 3,784 14.452 9342 4.294 2227 502 34,941 2020 FORM 10-45 We also have the following outstanding short term debt obligations as of May 31, 2020. Refer to Note 7 Short-Term Borrowings and Credit Lines in the accompanying Notes to the Consolidated Financial Statements for further description and interest rates related to the short term debt obligations listed below. D AS OF MAY 31, 2020 Notes payable, dua at mutually agreed-upon dates within one year of issuance or on demand As of May 31, 2020, we had bank guarantees and letters of credit outstanding totaling $239 million, issued primarily for real estate agreements, self-insurance programs and other general business obligations. 740 As of May 31, 2020, the Company held $396 million of available-for-sale det seour ties with maturity dates within one year and $43 million with maturity dates over ane year and less than five years in Short-term kovostments on the Consalidated Balance Shoots. The fair value of the Company's available-for-sale debt securities approximate their amortized cont Included in Interest expense (incomel, net was interest Income related to the Company's Investment portfolio of $82 milion, $82 milion and $70 million for the years ended May 31, 2020, 2019 and 2018, respectively The Company elects to record the grass assets and abilities of its derivative financial instruments on the Consolidated Balance Sheets. The Company's derivative financial instruments are subject to master nating amangements that allow for the offset of assets and liabilities in the event of default or early termination of the contract. Any amounts of cash collateral received related to these instruments associated with the Company's credit-related contingent features are recorded in Cash and equivalents and Accrued Nabines, the latter of which would further offset against the Company's derivative asset barance. Any amounts of cash colateral posted related to those instruments associated with the Company's credit-related contingent features are recorded in Propaid expenses and other cument assots, which would further offset against the Company's derivative labilly balance. Cash colateral received or posted related to the Company's credit related contingent features is presented in the Cash provided by operatione component of the Consolidated Statements of Cseh Flows. Any amounts of non-cash collateral received, such as securities, are not recorded on the Corsoidsted Balance Sheets pursuant to US GAAP. For further information related to credit risk, refer to Note 14-Risk Management and Derivatives. The following tables present information about the Company's derivative assets and abilities measured at fair value on a recurring basis as of May 31, 2020 and 2019 and indicate the level in the fair value hierarchy in which the Company classifies the fair value measurement. MAY 31, 2020 Der Level 2 Foreign excharge forwards and opens) Embedded derivatives TOTAL Table of Contents (Dolors) Level 2: Foreign exchange forwards and options() Embedded derivatives TOTAL $ $ ASSETS AT FAIR VALUE 205 $ 2 207 $ ostage des adm.Dohor Baby Shows, the candy pastors would be used by 57631, 2009 Ashant cash card orded on the stand outsily to the Agg. $ 94 $ 1 95 S ASSETS AT FAIR VALUE DERIVATIVE ASSETS OTHER CURRENT ASSETS 611 S 11 822 S 91 S $ 1 92 $ DERIVATIVE ASSETS OTHER CURRENT ASSETS OTHER LONG-TERM ASSETS 811 s 5 616 S 3 OTHER LONG-TERM ASSETS $ (targe davale val's had boom te onte Corsaed Sabrev Shovia, he aandky poador east would be reduced by or as May 21, 2015). As u hacke the Company has recewed 2 men oca cara Company debaty b 4, 2 No transfers among the levels within the fair value hierarchy occurred during the years ended May 31, 2020 or 2018. $ MAY 31, 2019 5 6 $ LIABILITIES AT FAIR VALUE $ DERIVATIVE LIABILITIES ACCRUED LIABILITIES LIABILITIES AT FAIR VALUE 188 $ 2 190 $ DERIVATIVE LIABILITIES ACCRUED LIABILITIES 51 $ 1 52 $ OTHER LONG-TERM LIADILITIES 17 17 2020 FORM 10-K 71 51 $ 3 $ 54 $ aber couragperdas ded fragen stage descriwww.post. OTHER LONG-TERM LIABILITIES 2 NON-RECURRING FAIR VALUE MEASUREMENTS As further discussed in Nota 20- Acquisitions and Diveatures, the Company met the criteris to recognize the related assets and Eshillies of in Brazi, Argentina, Chile and Uruguay enties as held-forase in the third quarter of facal 2020 and the dessification of the belancas namain as such as of May 31, 2020. This required the Company to remeasure the disposal groups at far value, less costs to sell, which is considered a Level 3 tair value measurement and was based on each transaction's estimated consideration at the date of close. The carrying value of the Argentina. Chile and Uruguay disposal groups exceeded their fair value, less costs to sal and as a result, the Company recognized a non-recurring impairment charge of $400 million. This charge was primarily due to the anticipated release of non-cash cumulative foreign currency translation losses which ware included as part of the carrying value of the Argentina, Chis and Uruguay disposal groups when measuring for impairment. For the fiscal year ended May 31, 2020, the charge was recognized in Other (income) expense, net on the Consolidated Statements of Income classified within Corporate, and a corresponding alowance within Accrued Liabies on the Consolicated Balance Sheets. All other assets or abilities required to be measured at fair value on a non-recuming basis as of May 31, 2020 were immaterial As of May 31, 2019, all assets or liabilities required to be measured at fair value on a non-recurring basis were immaterial. 2020 FORM 10-K 72 Table of Contents >1 NOTE 7 - SHORT-TERM BORROWINGS AND CREDIT LINES 1 Notas payable as of May 31, 2020 and 2019 are summarized below: D Moters pybe Commercial papen!) US opsestions Non-U.S. operations TOTAL NOTES PAYABLE Compane berge with a greater the marched Procock fromagnetof de leevence sex on the Castle of Ca $ $ BORROWINGS 248 E 248 2020 MAY 31 INTEREST RATE 1.66% 0.00% 0.00% $ $ BORROWINGS - 2 9 2019 INTEREST RATE acns 0.00% 12 25.00% (2) Modamage ostaldoonoring arrats The carrying amounts reflected in the Consolidated Balance Sheets for Notes payable approximate fair value. On August 16, 2019., the Compeny entered into a committed credit facility agreement with a syndicate of banks which provides for up to $2 bilion of borrowings, with the option to increase borrowings up to $3 billion in total upon lender approval The facility matures un Auguel 16, 2024, with a one your extension option prior to any anniversary of the closing date, provided that in no event shall it extend beyond August 15, 2026. Based on the Company's current long term senior unsecured debt ratings of AA and A1 from Standard and Poor's Corporation and Moody's Investor Services, respectively, the interest rate charged on any outstanding borrowings would be the prevailing LIBOR pus 0.46%. The facility fea is 0.04% of the total commitment. This facility replaces the prior $2 billion credit facility agrement entered into on August 28, 2015, which would have matured August 28, 2020. As of and for the periods ended May 31, 2020 and 2019, no amounts were outstanding under either committed credit facility. On April 5, 2020, the Company entered into a commited credit facility agreement with a syndicate of banks which provides for up to $2 billion of borrowings, in addition to the existing credit facility discussed above. The new facility matures on April 5, 2021. Based on the Company's current long-term senior unsecured cebt ratings of AA-and A1 from Standard and Poor's Corporation and Moody's Investor Services, respectively, the interest rate charged on any outstanding borrowings would be the prevailing LIBCR pka 1.05%. The facility fee is 0.20% of the total commitment. As of May 31, 2020 no amounts were outstanding under this commilled c facility. ↑ NOTE 8 - LONG-TERM DEBT •1 Long term debt net of unamortized premiums, ciscounts and debt issuance costs, comprises the following: Scheed Monty (Dolars and ten in milons) Corporate Term Debc12 May 1, 2023 March 27, 2025 November 1, 2026 March 27, 2027 March 27, 2030 March 27, 2040 May 1, 2043 November 1, 2045 November 1, 2048 March 27, 2060 Japanese Yer Notes August 20, 2001 through November 20, 2020 August 20, 2001 through November 20, 2020 Total Less current matunities TOTAL LONG-TERM DEBT 1 $ V ORIGINAL PRINCIPAL 500 1,000 1,000 1,000 1,500 1,000 500 1,000 500 1,500 9,000 4,000 INTEREST RATE (MELNOSumeda (al of #136 AWonin basa ate part in the spowerment to purchas a datbler oder in Apur, mezi 200 as confort The scheduled maturity of Long-term debt in each of the years ending May 31, 2021 through 2025 are $3 milion. $0 milon, $500 milion, 50 milion and $1,000 milion, respectively, at face value. 2.25% 2.40% 2.38% 2.75% 2.85% 3.25% 3.83% 3.88% 3.30% 3.38% 2.80% 2.00% kata mutru in aqualquariaty itatabores dating the period August 20, 2007 through forever 21, 2009 INTEREST PAYMENTS Semi-Annusly Semi Annualy Semi-Armusly Semi-Annualy Semi-Arnusly Semi-Annualy Semi-Arnusly Semi-Annualy Semi-Arnualy Semi-Annualy Quarterly Quarterly $ $ $ BOOK VALUE OUTSTANDING AS OF MAY 31, 2020 499 $ 994 995 994 1,489 985 495 984 491 1,480 2 $ 1 9,409 3 9,406 $ 2019 498 De 994 = 3 495 983 491 (Thessarecured person with the Company's oeteruenced and u at presque ton onder of (2) The Company 100% of the aggregate score of the acts to be seed or there of the meets the secteued parents, phuc in each case, and an apa wae abarca per a protes which the hondenberedared at a price ajun 75% of age and out of the roses buing redused. Dus v and paid oor der do Far Ca? Dutu s obfred in the respective na 6 3 3.470 6 3,464 The Company's long-term debt is recorded at adjusted cost, net of unamortized premiums, discounts and debt issuance costs. The fair value of long-term debt is estimated based upon cuoted prices for similar instruments or quoted prices for identical instruments in inactive markets (Level 2). The fair value of the Company's long- term debt, including the current portion, was approximately $10.545 million at May 31, 2020 and $3,524 million at May 31, 2019. 2020 FORM 10-K 74 ↑ ✔ NOTE 9 - INCOME TAXES income before income taxes is as follows: (Dos Income before income taxes: United States Foreign TOTAL INCOME BEFORE INCOME TAXES •1 The provision for income taxes is as follows (D Current United States Federal Stala Foreign Total Cament Deferred United States Federal State Foreign Total Deferred TOTAL INCOME TAX EXPENSE $ $ $ $ 2020 2020 2,954 $ (67) 2,887 $ (109) $ 81 756 728 (231) (47) (102) (380 348 $ YEAR ENDED MAY 31, 2019 593 4,208 4,001 $ 3 YEAR ENDED MAY 31, 2019 74 $ 56 608 735 (33) (9) 76 34 7TZ $ 2018 2018 744 3.581 4,325 1.167 45 533 1.745 380 25 27 647 2.392 1 On December 22, 2017, the US enacted the Tax Cuts and Jobs Act (The "Tax Act") which sicnificantly changed previous U.S. ax laws, including a reduction in the corporate tax rate from 35% to 21% and a one-time transition tax on deemed repatriation of undistributed foreign eamings. For fecal 2018 the change in the corporale tax rate resulted in a blended U.S. federal statutory rate for the Company of approximately 29% As of May 31, 2020 and 2018, long-term income taxes payable were $757 milion and $902 milion, respectively, and were included within Deferred income tases and other assets on the Consolidated Balance Sheels A reconciliation from the U.S. statutory federal income tax rate to the effective income tax rate is as follows: Federal income tax rate State taxes, net of federal benefit Foreign earnings Foreign-derived intangible income benefit related to the Tax Act Transition tax related to the Tax Act Remeasurement of deferred tax assets and liabilities related to the Tax Act Excess tax benefits from share-based compensation Income tax audits and contingency reserves U.S. research and development tax credit Other, net EFFECTIVE INCOME TAX RATE 2020 Table of Contents 21.0% 0.8% 5.9% -8.1 % % -% -7.2 % -1.4% -1.8% 2.9% 12.1% YEAR ENDED MAY 31, 2019 21.0% 1.0% -1.1% % % % -3.6% 1.3% -1.0% -1.5% 16.1% 2018 29.2 % 0.8% -19.2% - % 43.3% 3.7 % -5.3% 2.9 % -0.6% 0.5% 55.3% | The effective tax rate for the fiscal year ended May 31, 2020 was lower than the effective tax rate for the fiscal year ended May 31, 2019 due to increased benefits from discrete items such as stock-based compensation. The foreign earnings rate impact shown above for the fiscal year ended May 31, 2020 includes withholding taxes of 6.5% and held for sale accounting items of 2020 FORM 10-K 75 2.9%, offset by a benefit for statutory rate differences and other items of 3.5%. The foreign derived intangible income benefit reflects U.S. tax benefits introduced by the Tax Act for companies serving foreign markets. This benefit became available to the Company as a result of a restructuring of its intellectual property interests. Income tax audit and contingency reserves reflect benefits associated with the modification of the treatment of certain research and development expenditures of 2.9% offset by an increase related to the resolution of an audit by the U.S. Internal Revenue Service ("IRS") and other matters of 1.5%. Included in other is the deferral of income tax effects related to intra-entity transfers of inventory of 2.3% and other items of 0.6%. The effective tax rate for the year fiscal ended May 31, 2019 was lower than the effective tax rate for the fiscal year ended May 31, 2018 due to significant changes related to the enactment of the Tax Act in fiscal year 2018 and reduction in the U.S. federal statutory rate to 21% in fiscal year 2019. Deserba wk SupOS SYN INCITES Comprise the following 35 or sil Deferred tax Inventaries Sales return reserves Deferred compensation Stock-based compensation Reserves and accrued liabilities Operating lease labites Capitalized research and development expancituras Net operating loss carry-forwards Other Total deferred tax assets Valuation allowanc Total deferred tax assets after valuation allowance Deferred tax liabilities: Foreign withholding tax on und stributed earnings of foreign subsidiaries Property, plant and equipment Right-of-use assets Other Total defamed tax liabilities NET DEFERRED TAX ASSET casino Unrecognized benefits, beginning of the period 1 The above amounts exclude deferred taxes of the Company's Brazil Argentina, Chile and Uruguay operations which are classified as held for sale on the Consolidated Balance Sheets as of May 31, 2020. See Note 20-Acquistions and Divestmures for additional information. -1 The following is a reconciliation of the changes in the gross balancs of unrecognized fac benelts as of Gross Increases related to prior period tax positions Gross decress related to prior period tax postiona Gross Increases related to current period tax postions Settlements Lapse of statute of Imitations Chenges due locumency translation UNRECOGNIZED TAX BENEFITS, END OF THE PERIOD 3 $ 2020 $ (171) czy 50 $ 808 $ 181 (58) (28) (11) 771 $ 2020 MAY 31, 2019 MAY 31. *²*385352201 1000** 84 116 296 166 491 (26) (165) (232) (423) (32) (852) S 732 5 $ 698 $ 86 (32) 81 (36) 11 808 $ 2019 2018 AA 128 271 156 101 - 81 125 928 (88) 840 (235) (189) (41) (484) 376 481 19 (12) 249 (20) 1 698 The Company recognizes interest and penalties related to income tax matters in income tax expense. The liability for payment of interest and penalties decreased by $16 million during the year ended May 31, 2020, increased by $17 million during the fiscal year ended May 31, 2019 and decreased by $14 million during the fiscal year ended May 31, 2018. As of May 31, 2020 and 2019, accrued interest and penalties related to uncertain tax positions were $158 million and $174 million, respectively (excluding federal benefit). The Company is subject to taxation in the United States, as well as various state and foreign jurisdictions. The Company is currently under audit by the IRS for fiscal years 2017 through 2019. The Company has closed all U.S. federal income tax matters through fiscal 2016, with the exception of certain transfer pricing adjustments. Tax years after 2009 remain open in certain major foreign jurisdictions. Although the timing of resolution of audits is not certain, the Company evaluates all domestic and foreign audit issues in the aggregate, along with the expiration of applicable statutes of limitations, and estimates that it is reasonably possible the total gross unrecognized tax benefits could decrease by up to $50 million within the next 12 months. In January 2019, the European Commission opened a formal investigation to examine whether the Netherlands has breached State Aid rules when granting certain tax rulings to the Company. The Company believes the investigation is without merit. If this matter is adversely resolved, the Netherlands may be required to assess additional amounts with respect to current and prior periods, and the Company's Netherlands income taxes in the future could increase. The Company historically provided for U.S. income taxes on the undistributed earnings of foreign subsidiaries unless they were considered indefinitely reinvested outside the United States. As a result of the enactment of the Tax Act, in fiscal 2018 the Company reevaluated its historic indefinite reinvestment assertion and determined that any historical or future undistributed earnings of foreign subsidiaries are no longer considered to be indefinitely reinvested. Effective January 1, 2020, however, the tax law in the Netherlands, one of the Company's major jurisdictions, changed. As a result of the change in law, the Company's undistributed earnings in the Netherlands are subject to withholding tax upon distribution. It is the Company's intention to indefinitely reinvest the historical earnings of its foreign subsidiaries outside North America prior to May 31, 2020 to ensure there is sufficient working capital to expand operations outside the United States. Accordingly, the Company has not recorded a deferred tax liability related to foreign withholding taxes on approximately $8.1 billion of undistributed earnings of these foreign subsidiaries as of May 31, 2020. Withholding taxes of approximately $1.2 billion would be payable upon the remittance of these undistributed earnings as of May 31, 2020. A portion of the Company's foreign operations benefit from a tax holiday, which is set to expire in 2021. This tax holiday may be extended when certain conditions are met or may be terminated early if certain conditions are not met. The tax benefit attributable to this tax holiday was $238 million, $167 million and $126 million for the fiscal years ended May 31, 2020, 2019 and 2018, respectively. The benefit of the tax holiday on diluted earnings per common share was $0.15, $0.10 and $0.08 for the fiscal years ended May 31, 2020, 2019 and 2018, respectively. Deferred tax assets at May 31, 2020 and 2019 were reduced by a valuation allowance. For the fiscal year ended May 31, 2020, a valuation allowance was provided for U.S. foreign tax credit carry-forwards and on tax benefits generated by entities with operating losses. For the fiscal year ended May 31, 2019, the valuation allowance provided primarily related to tax benefits generated by certain entities with operating losses. There was a $62 million net decrease in the valuation allowance for the fiscal year ended May 31, 2020, compared to a $7 million net decrease for the fiscal year ended May 31, 2019, and $13 million net increase for the year ended May 31, 2018. The decrease in the Company's net valuation allowance for the fiscal year ended May 31, 2020 is primarily related to the classification of the Company's Brazil and Argentina operations as held-for-sale on the Consolidated Balance Sheets as of May 31, 2020. See Note 20- Acquisitions and Divestitures for additional information. The Company has recorded deferred tax assets of $15 million at May 31, 2020 for U.S. foreign tax credit carry-forwards which will begin to expire in 2030. -| The Company has available domestic and foreign loss carry-forwards of $83 million at May 31, 2020. If not utilized, such losses will expire as follows: (Dollars in millions) Net operating losses $ 2021 $ 2022 3 $ 2023 2 $ YEAR ENDING MAY 31, 2024 2 $ 2025-2040 59 $ INDEFINITE 17 $ I The above amounts at May 31, 2020 exclude net operating loss carry-forwards of the Company's Brazil, Argentina and Chile operations which are included in assets held-for-sale on the Consolidated Balance Sheets at May 31, 2020. See Note 20- Acquisitions and Divestitures for additional information. TOTAL 83 NOTE 10 - REDEEMABLE PREFERRED STOCK Soitz America is the sole owner of the Company's authorized redeemable preferred stock, $1 par value, which is redeemable at the option of Soltz America or the Company at par value aggregating $0.3 milion. Acumulative dividend of $0.10 per share is payable annually on May 31 and no dividends may be declared or paid on the common stock of the Company unleas dividends on the redeemabia prefamed slack have been declared and paid in full. There have been no changes in the redeamable preferred stock in the fiscal years ended May 31, 2020, 2019 and 2018. As the holder of the redeemable preferred steck, Sojitz America does not have general voting rights, but does have the right to vote as a separate class on the sale of al or substantally all of the assets of the Company and its subsidiaries, on merger, consolidation, Iquication or dissolution of the Company, or on the sale or assignment of the NIKE trademark for athletic footwear sold in the United States. The receemable preferred stock has been fuly issued to Sojitz America and is not blank check preferred stock. The Company's articles of incorporation de not permit the issuance of additional prefamed stock NOTE 11 - COMMON STOCK AND STOCK-BASED COMPENSATION COMMON STOCK The authorized number of shares of Class A Common Stock, na par value, and Class B Common Stock, no par valve, are 400 million and 2,400 milion, respectively. Each share of Class A Commen Stock is camenible into one share of Class 8 Common Stock Veting rights of Class B Common Stock are limited in certain circumstances with respect to the election of directors. There are no differences in the dividend and liquidation preferences or participation rights of the hakers of Class A and Class B Common Stock From time to time, the Company's Board of Directors authartzes share repurchase programs for the repurchase of Class B Common Stock. The value of repurchased shares is deducted from Total shareholders' equity through allocation to Capital in excess of stated value and Retained earnings. STOCK-BASED COMPENSATION The NIKL, Inc. Stock Incentive Plan (the Stock Incentive Plan) provices for the issuance of up to 718 milion previously unissued shares of Class B Common Stock in connection with equity awards granted under the Stock Incentive Plan. The Stock Incentive Plan authorizes the grant of non-statutory stock options, incentive stock options, stock appreciation rights, restricted stock, restricted stock units and performance-based awards. The exercise price for stock options and stock appreciation rights may not be less than the fair market value of the underlying shares on the date of grant. A committee of the Board of Directors administers the Stock Incentive Plan. The commitee has the authority to determine the employees to whom awards will be made, the amount of the awards and the other terms and conditions of the awards. The Company generally grants stock options and restricted stock on an annual basis. Substantally all awards under the Stock Incentive Plan vast ratably over 4 years of continued employment, with stock options expiring 10 years from the date of grant 1 The following table summarizes the Company's total stock-based compensation expense recogrized in Cost of sales or Operating overhoed expense, as applicable: Dala Stock options ESPPS Restricted stock TOTAL STOCK-BASED COMPENSATION EXPENSE $ $ 2020 237 53 139 429 $ $ YEAR ENDED MAY 31, 2019 207 $ 40 TU 325 $ A. Exponenckatorenches the sense cted with a proshe rights Acceleated stock option expense e vecorded for mye menking atas vavimant egy vestments. Acced ek opto expresse 553 mon 541 maand 51m tor the fesi yere ended My 24, 2020 2019 and 2015 respectively The income tax benefit related to stock-based compensation expense was $207 million, $175 million and $230 million for the fiscal years ended May 31, 2020, 2019 and 2018, respectively and reported within income tax expense 2018 148 34 35 218 STOCK OPTIONS The weighted average fair value per share of the options granted during the years ended May 31, 2020, 2019 and 2018, computed as of the grant date using the Black-Scholes pricing model, was $18.71, $22.78 and $9.82, respectively. The weighted average assumptions used to estimate these fair values were as follows: YEAR ENDED MAY 31, 2019 Dividend yield Expected volatility Weighted average expected life (in years) Risk-free interest rate The following summarizes the stock option transactions under the plan discussed above: Options outstanding as of May 31, 2019 Exercised Forfeited Granted Options outstanding as of May 31, 2020 2020 1.0% 23.0% 6.0 1.5% EMPLOYEE STOCK PURCHASE PLANS Expected volatilities are based on the historical volatility of the Company's common stock, the implied volatility in market traded options on the Company's common stock with a term greater than one year, as well as other factors. The weighted average expected life of options is based on an analysis of historical and expected future exercise patterns. The interest rate is based on the U.S. Treasury (constant maturity) risk-free rate in effect at the date of grant for periods corresponding with the expected term of the options. SHARES(1) (In millions) 91.3 (20.1) (2.2) 19.1 88.1 $ 1.0% 26.6% 6.0 2.8% $ 2018 1.2% 16.4% 6.0 2.0% WEIGHTED AVERAGE OPTION PRICE 50.59 35.26 75.74 85.29 60.98 (1) Includes stock appreciation rights transactions. Options exercisable as of May 31, 2020 were 48.5 million and had a weighted average option price of $46.91 per share. The aggregate intrinsic value for options outstanding and exercisable at May 31, 2020 was $3,316 million and $2,506 million, respectively. The total intrinsic value of the options exercised during the years ended May 31, 2020, 2019 and 2018 was $1,161 million, $938 million and $889 million, respectively. The intrinsic value is the amount by which the market value of the underlying stock exceeds the exercise price of the options. The weighted average contractual life remaining for options outstanding and options exercisable at May 31, 2020 was 6.2 years and 4.5 years, respectively. As of May 31, 2020, the Company had $411 million of unrecognized compensation costs from stock options, net of estimated forfeitures, to be recognized in Cost of sales or Operating overhead expense, as applicable, over a weighted average remaining period of 2.6 years. The following summarizes the restricted stock and restricted stock unit activity under the plan discussed above: Nonvested as of May 31, 2019 Verled Fortellad Granted Nonvested as of May 31, 2020 in magpl per alste distal Net income available to common stockholders Determination of shares: Waighted average common shares outstanding Assumed conversion of dilutive stock options and awards DILUTED WEIGHTED AVERAGE COMMON SHARES OUTSTANDING Earnings per common share Basic Ciutad J 1 $ $ इ SHARES 2020 I The weighted average fair value por share of restricted stock and restricted stock units granted for the years ended May 31, 2020, 2019 and 2018, computed as of the grant date, was $88.26, $80.95, and $62.51, respectively. During the years ended May 31, 2020, 2019 and 2018, the aggregate fair value of restricted stock and restricted alock units veated was $98 million, $44 milion and $113 milion, respectively, comoded as of the date of vesting. As of May 31, 2020, the Company had $342 milice of unrecognized compensation costs from restricted stock and restricted stock unts, net of estimated forfeitures, to be recognized in Cour of sales or Operating overhead expense, as applicable, over a weighted average remaining period of 2.7 years. ►l NOTE 12- EARNINGS PER SHARE -1 The following is a reconciliation from basic eamings per common share to diluted earnings per common shere. The computations of diluted earnings per common share excluded options, including shares under ESPPs, and restricted stock to purchase an additional 20.6 milion 17.5 milion and 42.9 million shares of common stock outstanding for the fiscal years ended May 31, 2020, 2019 and 2018, respectively, because the options and restricted stock were ad-diutive. 2,539 $ 1.558.8 32.8 1,591.6 44 (1.1) (0.31 3.5 8.8 $ 1.63 $ 1.80 3 S WEIGHTED AVERAGE GRANT DATE FAIR VALUE YEAR ENDED MAY 31, 2019 4,029 S 1,579 7 38.7 1,618.4 70.93 72.64 79.62 2:06 S 2.40 S 88.26 79.84 2018 1.933 1.623.8 36.3 1.650.1 1.19 1.17 NOTE 14 RISK MANAGEMENT AND DERIVATIVES The Company is exposed to global market risks, including the effect of changes in foreign currency exchange rates and interest rates, and uses derivatives to manage financial exposures that occur in the normal course of business. The Company does not hold or issue derivatives for trading or speculative purposes. The Company may elect to designate certain derivatives as hedging instruments under U.S. GAAP. The Company formally documents all relationships between designated hedging instruments and hedged items as well as its risk management objectives and strategies for undertaking hedge transactions. This process includes linking all derivatives designated as hedges to either recognized assets or liabilities or forecasted transactions and assessing, both at inception and on an ongoing basis, the effectiveness of the hedging relationships. The majority of derivatives outstanding as of May 31, 2020 are designated as foreign currency cash flow hedges, primarily for Euro/U.S. Dollar, British Pound/Euro, Japanese Yen/U.S. Dollar and Chinese Yuan/U.S. Dollar currency pairs. All derivatives are recognized on the Consolidated Balance Sheets at fair value and classified based on the instrument's maturity date. The following tables present the fair values of derivative instruments included within the Consolidated Balance Sheets as of May 31, 2020 and 2019: (Dollars in millions) Derivatives formally designated as hedging instruments: Foreign exchange forwards and options Foreign exchange forwards and options Total derivatives formally designated as hedging instruments Derivatives not designated as hedging instruments: Foreign exchange forwards and options Embedded derivatives Foreign exchange forwards and options Embedded derivatives Total derivatives not designated as hedging instruments TOTAL DERIVATIVE ASSETS DERIVATIVE ASSETS BALANCE SHEET LOCATION Prepaid expenses and other current assets $ Deferred income taxes and other assets Prepaid expenses and other current assets Prepaid expenses and other current assets Deferred income taxes and other assets Deferred income taxes and other assets $ 2020 43 1 44 48 1 2 51 95 MAY 31, $ $ 2019 509 509 102 5 6 113 622 (Dollars in millions) Derivatives formally designated as hedging instruments: Foreign exchange forwards and options Foreign exchange forwards and options Total derivatives formally designated as hedging instruments Derivatives not designated as hedging instruments: Foreign exchange forwards and options Embedded derivatives Embedded derivatives Total derivatives not designated as hedging instruments TOTAL DERIVATIVE LIABILITIES (Dollars in millions) Revenues Cost of sales Demand creation expense Other (income) expense, net Interest expense (income), net $ 2020 FORM 10-K 82 TOTAL 37,403 21,162 3,592 139 89 The following table presents the amounts in the Consolidated Statements of Income in which the effects of cash flow hedges are recorded and the effects of cash flow hedge activity on these line items for the fiscal years ended May 31, 2020, 2019 and 2018: $ 2020 The following tables present the amounts affecting the Consolidated Statements of Income for the years ended May 31, 2020, 2019 and 2018: AMOUNT OF GAIN (LOSS) ON CASH FLOW HEDGE ACTIVITY (17) 364 (2) 181 (7) $ BALANCE SHEET LOCATION Accrued liabilities $ Deferred income taxes and other liabilities DERIVATIVE LIABILITIES Accrued liabilities Accrued liabilities Deferred income taxes and other liabilities TOTAL 39,117 21,643 3,753 YEAR ENDED MAY 31, 2019 (78) 49 $ $ AMOUNT OF GAIN (LOSS) ON CASH FLOW HEDGE ACTIVITY (5) $ 53 35 (7) 2020 173 17 190 15 2 17 207 MAY 31, TOTAL 36,397 20,441 3,577 66 54 $ $ $ 2018 2019 5 5 46 1 2 49 54 AMOUNT OF GAIN (LOSS) ON CASH FLOW HEDGE ACTIVITY 34 (90) 1 (69) (7) -1 The following table summarizes the reclassifications from Accumulated other comprehensive income (loss) to the Consolidated Statements of Income: (Dollars in millions) Gains (losses) on foreign currency translation adjustment Total before tax Tax (expense) benefit Gain (loss) net of tax Gains (losses) on cash flow hedges: Foreign exchange forwards and options Foreign exchange forwards and options Foreign exchange forwards and options Foreign exchange forwards and options Interest rate swaps Total before tax Tax (expense) benefit Gain (loss) net of tax Gains (losses) on other Total before tax Tax (expense) benefit Gain (loss) net of tax Total net gain (loss) reclassified for the period $ $ $ AMOUNT OF GAIN (LOSS) RECLASSIFIED FROM ACCUMULATED OTHER COMPREHENSIVE INCOME (LOSS) INTO INCOME YEAR ENDED MAY 31, 2020 (1) (1) (1) (17) 364 (2) 181 (7) 519 (2) 517 1 1 $ 1 517 $ 2019 (5) 53 35 (7) 76 (6) 70 RFF FE 17 17 17 87 LOCATION OF GAIN (LOSS) RECLASSIFIED FROM ACCUMULATED OTHER COMPREHENSIVE INCOME (LOSS) INTO INCOME Other (income) expense, net Revenues Cost of sales Demand creation expense Other (income) expense, net Interest expense (income), net Other (income) expense, net NOTE 16 REVENUES DISAGGREGATION OF REVENUES >I The following tables present the Company's revenues disaggregated by reportable operating segment, major product line and by distribution channel: Daterin Revan by: Footwear Apparel Equipment Other TOTAL REVENUES Revenues by: Sales to Wholesale Customers Sales through Cirect to Consumer Other TOTAL REVENUES M Revenues by: Footwear Apparel Equipment Other TOTAL REVENUES Revenues by: Sales la Wholesale Customers Sales through Direct to Consumer Other TOTAL REVENUES $ $ S $ $ $ $ $ NORTH AMERICA 9,329 4.639 016 - 14,404 $ 9,371 5,113 14.484 NORTH AMERICA 10,045 5.260 587 15.902 10.875 5.027 $ 3 5 $ 3 5 3 15,902 $ EUROPE, MIDDLE EAST & AFRICA 5,892 $ 3,053 402 = 9,347 $ 6,574 $ 2,773 9,347 EUROPE, MIDDLE EAST & AFRICA 8.293 3,087 432 9,812 7,076 2,736 5 $ $ S 9,812 $ GREATER CHINA 4,635 $ 1,895 145 - 6,679 $ 3,903 2,878 6,679 GREATER CHINA 4,262 1,808 138 8,208 3.728 2,482 $ S $ 5 S 6,208 $ ASIA PACIFIC & LATIN AMERICA 3,449 S $ 1.365 214 = 3,026 $ 3,408 $ 1,620 5,028 ASIA PACIFIC & LATIN AMERICA 3.822 1,395 237 5.254 3,748 1,608 5,254 $ 3 5 3 $ YEAR ENDED MAY 31, 2020 GLOBAL BRAND DIVISIONS - = 30 30 TOTAL NIKE BRAND = 42 42 $ = = 42 42 $ - 30 30 $ $ YEAR ENDED MAY 31, 2019 GLOBAL BRAND DIVISIONS $ $ TOTAL NIKE BRAND $ 23.306 $ 10.963 1.280 30 35,568 $ 23.156 40.100 12,382 30 35,568 24 222 11.560 1.404 42 37,218 $ S $ $ S $ 25.423 11.703 42 37 218 $ $ CONVERSE 1,642 80 20 90 1.846 CONVERSE 1,104 600 90 1,846 $ 1.608 118 24 100 1,906 $ 1.247 $ $ $ $ S 106 1.906 $ CORPORATE $ =s = (11) (11) $ =$ = (11) (11) S CORPORATE = S = (7) (7) S = $ (7) (7) $ TOTAL NIKE, INC. 24,947 11,042 1,305 100 37,403 24,310 12,984 109 37,403 TOTAL NIKE, INC. 25,850 11,668 1,428 141 39,117 28,670 12,306 141 39,117 For the fiscal years anded May 31, 2020 and 2019, Other revenues for Global Brand Divisions and Converse ware primarily attributable to icensing businesses. For the fiscal years ended May 31, 2020 and 2019, Other revenues for Corporate primary consisted of foreign cumancy hedge gains and losses related to revenues generated by entities within the NIKE Brand geographic operating segments and Converse but managed through the Company's centrs foreign exchange risk management program. As of May 31, 2020 and 2018, the Company did not have any contract assets and had an immaterial amount of contract liabilities recorded in Accrued Lisbines on the Consolidated Balance Sheets. ↑ SALES-RELATED RESERVES At May 31, 2020 and May 31, 2019, the Company's sales-related reserve balance, which includes returns, post-invoice sales discounts and miscellaneous claims, was $1,178 million and $1,218 million, respectively, recorded in Accrued liabilities on the Consolidated Balance Sheets. The estimated cost of inventory for expected product returns was $313 million and $410 million as of May 31, 2020 and May 31, 2019, respectively, and was recorded in Prepaid expenses and other current assets on the Consolidated Balance Sheets. MAJOR CUSTOMERS No customer accounted for 10% or more of the Company's consolidated net Revenues during the fiscal years ended May 31, 2020, 2019 and 2018. ▶I NOTE 17 OPERATING SEGMENTS AND RELATED INFORMATION The Company's operating segments are evidence of the structure of the Company's internal organization. The NIKE Brand segments are defined by geographic regions for operations participating in NIKE Brand sales activity. Each NIKE Brand geographic segment operates predominantly in one industry: the design, development, marketing and selling of athletic footwear, apparel and equipment. The Company's reportable operating segments for the NIKE Brand are: North America; Europe, Middle East & Africa (EMEA); Greater China; and Asia Pacific & Latin America (APLA), and include results for the NIKE and Jordan brands, with the results for the Hurley brand, prior to its divestiture, included in North America. Refer to Note 20- Acquisitions and Divestitures for information regarding the divestiture of the Company's wholly-owned subsidiary, Hurley, and the planned transition of NIKE Brand businesses in certain countries within APLA to third-party distributors. The Company's NIKE Direct operations are managed within each NIKE Brand geographic operating segment. Converse is also a reportable segment for the Company, and operates in one industry: the design, marketing, licensing and selling of athletic lifestyle sneakers, apparel and accessories. Global Brand Divisions is included within the NIKE Brand for presentation purposes to align with the way management views the Company. Global Brand Divisions primarily represent NIKE Brand licensing businesses that are not part of a geographic operating segment, and demand creation and operating overhead expense, including product creation and design expenses that are centrally managed for the NIKE Brand, as well as costs associated with NIKE Direct global digital operations and enterprise technology. Corporate consists primarily of unallocated general and administrative expenses, including expenses associated with centrally managed departments; depreciation and amortization related to the Company's headquarters; unallocated insurance, benefit and compensation programs, including stock-based compensation; and certain foreign currency gains and losses, including certain hedge gains and losses. For the fiscal year ended May 31, 2020, Corporate includes the non-recurring impairment charge, recognized as a result of the Company's decision to transition its operations in Brazil, Argentina, Chile and Uruguay to third-party distributors. This charge primarily reflects the anticipated release of associated non-cash cumulative foreign currency translation losses. For more information regarding this charge, refer to Note 20-Acquisitions and Divestitures. The primary financial measure used by the Company to evaluate performance of individual operating segments is earnings before interest and taxes (EBIT), which represents Net income before Interest expense (income), net and Income tax expense in the Consolidated Statements of Income. As part of the Company's centrally managed foreign exchange risk management program, standard foreign currency rates are assigned twice per year to each NIKE Brand entity in the Company's geographic operating segments and to Converse. These rates are set approximately nine and twelve months in advance of the future selling seasons to which they relate (specifically, for each currency, one standard rate applies to the fall and holiday selling seasons and one standard rate applies to the spring and summer selling seasons) based on average market spot rates in the calendar month preceding the date they are established. Inventories and cost of sales for geographic operating segments and Converse reflect the use of these standard rates to record non-functional currency product purchases in the entity's functional currency. Differences between assigned standard foreign currency rates and actual market rates are included in Corporate, together with foreign currency hedge gains and losses generated from the Company's centrally managed foreign exchange risk management program and other conversion gains and losses. Accounts receivable, net, Inventories and Property, plant and equipment, net for operating segments are regularly reviewed by management and are therefore provided below. Da REVENUES North America Europe, Middle East & Africe Greater Chine Asia Pacific & Latin America Global Brand Division Total NIKE Brand Converse Corporate TOTAL NIKE, INC. REVENUES EARNINGS BEFORE INTEREST AND TAXES North America Europe, Middle East & Africa Greater China Asia Pacific & Latin America Global Brand Divisions Cover Corporate interest expenes (incomel, net TOTAL NIKE, INC. INCOME BEFORE INCOME TAXES ADDITIONS TO PROPERTY. PLANT AND EQUIPMENT North America Lurope, Middle East & Africa Greater China As a Pacho & Latin America Global Brand Divisions Total NIKE Drand Convers Corporate TOTAL ADDITIONS TO PROPERTY, PLANT AND EQUIPMENT DEPRECIATION North America Europe, Middle East & Africa Greater Ching Asia Pacific & Latin Americs Global Brand Divisions Total NIKE Brand Converse Corporate TOTAL DEPRECIATION S $ $ S S S S $ 2020 14,454 S 9,347 6,679 5.028 30 35,568 1,940 (11) 37,403 $ 2,899 S $ 1.541 2,490 1.164 (3,468) 297 (1,967) 89 2,887 $ 110 1 S 139 28 41 438 756 12 350 1,124 S 145 $ 132 44 46 214 584 25 112 721 S $ 2019 2637-63*= $359§¤€*; EN••**³8§ 2=****-:* 15.902 $ 37.218 39,117 $ (3.262) (1.810) $ $ S $ 149 S $ 706 $ 2018 છે - ક ર લ ત ાઇFe||Yકા બાર ક ક કા કામનું | (Dollars in millions) ACCOUNTS RECEIVABLE, NET North America Europe, Middle East & Africa Greater China Asia Pacific & Latin America(1) Global Brand Divisions Total NIKE Brand Converse Corporate TOTAL ACCOUNTS RECEIVABLE, NET INVENTORIES North America Europe, Middle East & Africa Greater China Asia Pacific & Latin America(1) Global Brand Divisions Total NIKE Brand Converse Corporate TOTAL INVENTORIES PROPERTY, PLANT AND EQUIPMENT, NET North America Europe, Middle East & Africa Greater China Asia Pacific & Latin America(1) Global Brand Divisions Total NIKE Brand Converse Corporate TOTAL PROPERTY, PLANT AND EQUIPMENT, NET $ $ $ $ $ $ 2020 AS OF MAY 31, 1,020 712 321 425 65 2,543 149 57 2,749 3,077 2,070 882 770 137 6,936 341 90 7,367 645 885 214 296 830 2,870 80 1,916 4,866 $ $ $ $ $ $ 2019 1,718 1,164 245 771 105 4,003 243 26 4,272 2,328 1,390 693 694 126 5,231 269 122 5,622 814 929 237 326 665 2,971 100 1,673 4,744 NOTE 19 - LEASES - Lease expense is recognized in Cost of sales or Operating overhead expense within the Consolidated Statements of Income, based on the underlying nature of the leased asset. For the fiscal year ended May 31, 2020, lease expense primarily consisted of operating lease costs of $569 million, along with $337 million primarily related to variable lease costs which includes an immaterial amount of short-term lease costs. As of and for the fiscal year ended May 31, 2020, finance leases were not a material component of the Company's lease portfolio. Amounts of future undiscounted cash flows related to operating lease payments over the lease term are as follows and are reconciled to the present value of the operating lease liabilities as recorded on the Consolidated Balance Sheets: (Dollars in millions) Fiscal 2021 Fiscal 2022 Fiscal 2023 Fiscal 2024 Fiscal 2025 Thereafter Total undiscounted future cash flows related to lease payments Less: Interest Present value of lease liabilities (Dollars in millions) Fiscal 2020 Fiscal 2021 Fiscal 2022 Fiscal 2023 Fiscal 2024 Thereafter TOTAL eing obligations include aloted to build to quit (1) Excludes $67 million of future operating lease payments for lease agreements signed but not yet commenced. In accordance with Topic 840, rent expense, excluding executory costs, was $829 million and $820 million for the fiscal years ended May 31, 2019 and 2018, respectively. ||Amounts of minimum future annual commitments under non-cancelable operating and capital leases in accordance with Topic 840 were as follows:|| AS OF MAY 31, 2019 CAPITAL LEASES AND OTHER FINANCING OBLIGATIONS(1) $ $ OPERATING LEASES 553 $ 513 441 386 345 $ 1,494 3,732 $ $ $ 32 34 40 37 34 197 374 $ AS OF MAY 31, 2020(1) $ TOTAL 550 514 456 416 374 1,474 3,784 426 3,358 585 547 481 423 379 1,691 4,106 The following table includes the weighted average remaining lease terms, in years, and the weighted average discount rate used to calculate the present value of operating lease liabilities: Weighted-average remaining lease term (years) Weighted-average discount rate -| The following table includes supplemental cash and non-cash information related to operating leases: (Dollars in millions) Cash paid for amounts included in the measurement of lease liabilities: Operating cash flows from operating leases Operating lease right-of-use assets obtained in exchange for new operating lease liabilities (1) (1) Excludes the amount initially capitalized in conjunction with the adoption of Topic 842. $ $ AS OF MAY 31, 2020 FISCAL YEAR ENDED MAY 31, 2020 8.7 2.4% 532 705 | SCHEDULE II - VALUATION AND QUALIFYING ACCOUNTS (Dollars in millions) Sales returns reserve (1) | (2) For the fiscal year ended May 31, 2018 For the fiscal year ended May 31, 2019(2) For the fiscal year ended May 31, 2020 Amounts included in this column primarily relate to foreign currency translation. $ 2020 FORM 10-K 100 BALANCE AT BEGINNING OF PERIOD 343 734 843 $ CHARGED TO COSTS AND EXPENSES 640 $ 1,959 1,941 As a result of the adoption of ASC Topic 606 during the first quarter of fiscal 2019, an asset for the estimated cost of inventory for expected products returns is now recognized separately from the liability for sales returns reserves, which is presented above. CHARGED TO OTHER ACCOUNTS(1) 5 (30) (31) $ WRITE-OFFS, NET (658) $ (1,820) (2,071) BALANCE AT END OF PERIOD 330 843 682 NIKE's Class B Common Stock is listed on the New York Stock Exchange and trades under the symbol NKE. At July 17, 2020, there were 23,114 holders of record of NIKE's Class B Common Stock and 14 holders of record of NIKE's Class A Common Stock. These figures do not include beneficial owners who hold shares in nominee name. The Class A Common Stock is not publicly traded, but each share is convertible upon request of the holder into one share of Class B Common Stock. Refer to Selected Quarterly Financial Data in Part II, Item 6 of this Report for dividends declared on the Class A and Class B Common Stock. In June 2018, the Board of Directors approved a four-year, $15 billion share repurchase program. As of May 31, 2020, the Company had repurchased 45.2 million shares at an average price of $89.00 per share for a total approximate cost of $4.0 billion under this program. All share repurchases were made under NIKE's publicly announced program and there are no other programs under which the Company repurchases shares. The following table presents a summary of share repurchases made during the quarter ended May 31, 2020: PERIOD March 1 - March 31, 2020 April 1- April 30, 2020 May 1 - May 31, 2020 TOTAL NUMBER OF SHARES PURCHASED 1,872,265 $ 1,872,265 $ AVERAGE PRICE PAID PER SHARE 85.08 $ $ 85.08 APPROXIMATE DOLLAR VALUE OF SHARES THAT MAY YET BE PURCHASED UNDER THE PLANS OR PROGRAMS (IN MILLIONS) 10,981 10,981 10,981 NIKE, INC. CONSOLIDATED STATEMENTS OF INCOME (In millions, except per share data) Revenues Cost of sales Gross profit Demand creation expense Operating overhead expense Total selling and administrative expense Interest expense (income), net Other (income) expense, net Income before income taxes Income tax expense NET INCOME Earnings per common share: Basic Diluted Weighted average common shares outstanding: Basic Diluted The accompanying Notes to the Consolidated Financial Statements are an integral part of this statement. 2020 FORM 10-K 56 $ $ $ $ 2020 37,403 $ 21,162 16,241 3,592 9,534 13,126 89 139 2,887 348 2,539 1.63 1.60 1,558.8 1,591.6 $ $ $ YEAR ENDED MAY 31, 2019 39,117 21,643 17,474 3,753 8,949 12,702 49 (78) 4,801 772 4,029 2.55 2.49 1,579.7 1,618.4 $ $ $ $ 2018 36,397 20,441 15,956 3,577 7,934 11,511 54 66 4,325 2,392 1,933 1.19 1.17 1,623.8 1,659.1 Find the most recent 10k (annual report filed with the SEC) for your chosen company Update the project spreadsheet so the headings (the dates on the columns) represent the most recent years that annual financial information is available for your company Search the 10K for the information you need to complete the Excel project spreadsheet. You will need to carefully review the 10k including the written company highlights and financial notes to find the necessary information, you will need to do calculations, you will need to provide additional competitive ratios (from other groups in the class, or by reviewing another companies 10K information from the Edgar database). You may need to review a prior years 10K to find all the information that you need. Your company may have more or fewer rows than what is listed in the spreadsheet template. I recommend consolidating financial information where reasonable and adding rows where required. Assume that you are my accounting analyst - and are summarizing the required information for senior management. Your balance sheet should balance! For each of the selected items on the income statement, determine its percentage relative to sales revenue. Adjust your income statement line items name to match you companies income statement. Be sure to use formatting and formulas for presentation and efficiencies. This is a Vertical, common size analysis) Fiscal Year Ended: Input FYE date: Income Statement Line: Names will vary) Sales or Revenue Cost of Sales Gross Profit/Margin Operating Expenses Income before Tax Provision for tax Net Income Other Major Items. Income Statement 2020 % 2019 % 2018 Based on the common-size analysis above, which item(s) appear to be the most significant in explaining the change in net income (profitability)? Discuss below: % NOTES TO CONSOLIDATED FINANCIAL STATEMENTS Summary of Significant Accounting Policies Inventories Note 1 Note 2 Note 3 Note 4 Note 5 Note 6 Note 7 Note 8 Note 9 Note 10 Note 11 Note 12 Note 13 Note 14 Note 15 Note 16 Note 17 Note 18 Note 19 Note 20 Note 21 Property, Plant and Equipment Identifiable Intangible Assets and Goodwill Accrued Liabilities Fair Value Measurements Short-Term Borrowings and Credit Lines Long-Term Debt Income Taxes Redeemable Preferred Stock Common Stock and Stock-Based Compensation Earnings Per Share Benefit Plans Risk Management and Derivatives Accumulated Other Comprehensive Income (Loss) Revenues Operating Segments and Related Information Commitments and Contingencies Leases Acquisitions and Divestitures Subsequent Events 62 69 69 69 70 70 73 74 75 78 78 80 80 81 86 88 89 92 92 93 94 2020 FORM 10-K 61 Wars! ASSETS Current assets Cash and equivalents Short-term investments Accounts rccolvable, not inventories Prepaid expenses and other current assets Total current s Property, plant and equipment, not Operating less right-of-use assets.net centMabic angible assets, not Goodwill Deferred income taxes and other assets TOTAL ASSETS LIABILITIES AND SHAREHOLDERS' EQUITY Current liablitics: Current portion of long-term debt Notes payable Accounts payable Current portion of operating lease labilbes Accrued liabilities Income taxes payable Total current liabilities Long-tam deb Operating lease liabilities Deferred income taxes and other labies an Commitments and contingendes (Noto 18) Redeemable preferred stock Shareholders' equity Comman stack at stated value: Class A convertibre-315 and 315 shares outstanding Class B-1,243 and 1,253 shares outstanding Capital in excess of stated value Accumulated other comprehensive Incoma loas) Retained eaminge (deficit) Total shareholders' culty TOTAL LIABILITIES AND SHAREHOLDERS' EQUITY $ $ $ $ 2020 8,348 4:39 2,749 7.367 1.663 20.506 4,866 3.097 274 223 2,326 31.342 3 248 2.248 445 5.184 156 8.224 9,406 2.913 2,684 3 3 8.299 (56) (191) $ $ $ 8,065 31.342 $ 2019 4,465 197 4,272 5,622 1,968 16,525 4,744 283 154 2,011 23,717 5 9 9 2,612 5,010 229 7,955 3,464 3,347 = 7,163 231 1,643 9,040 23,717 Net income Adjustments to reconcic net income to net cash provided (used) by operations: Decrecision Deferred income taxes Stock-based compensation Amortization, impairment and other Net foreign cumarcy adjustments Changes in certain working capital components and other assets and liabilities: (Inca) decrease in accounts receivable increase) decrease in invertones (Incen) decrease in prepaid expansak, operating kase right-of-use assets and other current and non-current sasats Increase (decrease) in accounts payable accrued liabilities, operating lease labines and other current and non-current liabilities Cash provided (used) by operations Cash provided lused) by investing activities: Purchases of short-term invalments. Matunities of short-term investments Sales of short-term investments Additions to property, plant and equipment Other investing activities Cash provided (used) by investing activities Cash provided (used) by financing activities: Proceeds from borrowings, net of debt issuance costs Increase (decrease) in notas payabla, nat Proceeds from exercise of stock options and other stock issuances Repurchase of common stock Dividends-common and preferred Other financing activities Cash provided (sed) by firencing activities Effect of exchange rate changes on cash and coulvakonts Net intresse (decrease) in cash and equivalenx Cash and equivalents, beginning of year CASH AND EQUIVALENTS, END OF YEAR Supplemental disclosure of cash flow information Cash paid during the year for Interest, net of capitalized interest Income taxes Non-cash additions to property plant and equipment Dividends declared and not paid $ $ 2.539 $ 721 (380) 429 398 23 1,239 1,854 (854) 24 2,485 12,4261 74 2,379 1,085 31 (1,025) 6,134 49 885 13.087) 11,452) (58) 2,491 1651 3.002 4,465 8,348 $ 140 $ 1,025 121 395 3 ***-* 50083 3¤¤€˜008¶¶§€733 P*** 4,029 $ 4,466 $ 153 $ - કાજી | Lal | Tet g sle Fo||RS & 11,028) 11,243 Table of Contents NIKE, INC. CONSOLIDATED STATEMENTS OF COMPREHENSIVE INCOME (Dollars in millions) Net income Other comprehensive income (loss), net of tax: Change in net foreign currency translation adjustment Change in net gains (losses) on cash flow hedges Change in net gains (losses) on other Total other comprehensive income (loss), net of tax TOTAL COMPREHENSIVE INCOME The accompanying Notes to the Consolidated Financial Statements are an integral part of this statement. $ $ 2020 2,539 $ (148) (130) (9) (287) 2,252 $ YEAR ENDED MAY 31, 2019 4,029 (173) 503 (7) 323 4,352 $ $ 2018 1,933 (6) 76 34 104 2,037 CONSOLIDATED STATEMENTS OF SHAREHOLDERS' EQUITY to store detal Balance at May 31, 2017 Stack options exercised Repurchase of Class B Common Stock Dividends on common stock (50.78 per share) and preferred stock (50.10 per share) Issuance of shares to employees, net of shares withheld for employee taxes Stock-based compensation Net income Other comprehensive income Bloss) Reclasstications to retained earnings in accordance with ASU 2018-02 Balance at May 31, 2018 Stock options exercised Conversion to Class B Common Stock Repurchase of Class B Common Stock Dividends on common stock (50.86 per share) and preferred stock (50.10 per share) Issuance of shares to employees, net of shares with held for employee taxes Stock-based compensation Net Income Other comprehensive income (ass) Adoption of ASU 2015-16 (Note 11 Adoption of ASC Topic 606 (Nota 1) Balance at May 31, 2019 Stack options axercised Repurchase of Class B Common Stock Dividends on common stock (50.955 per share) and preferred stock (50.10 per share) Issuance of shares to employees, net of shares with held for employee taxes Stock-based compansation Net Income Other comprehensive income (loss) Adoption of ASC Toplo 842 (Nete 11 Balance at May 31, 2020 CLASS A SHARES 329 $ 329 $ 315 $ $ 315 $ COMMON STOCK AMOUNT SHARES 1,314 $ 24 (70) CLASS B 4 1,272 18 14 3 1,253 20 (34) 4 S $ 1.243 S AMOUNT 3 $ 3 $ 3 $ 3 $ CAPITAL IN EXCESS OF STATED VALUE 5,710 800 (254) 110 218 8,384 539 12271 142 325 7,163 703 11611 165 4:29 ACCUMULATED OTHER COMPREHENSIVE INCOME (LOSS) $ S S S 8,299 S (213) $ 104 17 192) S 323 231 (267) $ 156) $ RETAINED EARNINGS (DEFICIT) 6,907 $ (4.013) (1265) 1.933 (17) 3.517 S (4.066) (1.360) (3) 4.029 (607) 23 1.643 $ (2.872) (1.491) (9) 2.539 (1) (191) $ TOTAL 12,407 800 (4,257 11,2685; 82 218 1,933 104 9,812 539 (4,283) 11.3801 139 325 4,029 323 (507) 23 9,040 703 13,033) 11.491) 150 429 2,539 (287) (1) 8,055 NOTE 6 - FAIR VALUE MEASUREMENTS ► The following tables present information about the Company's financial assets measured at fair value on a recurring basis as of May 31, 2020 and 2019 and indicate the level in the fair value hierarchy in which the Company classifies the fair value measurement. Refer to Nata 1-Summary of Significant Accounting Policies for accions dels regarding the Company's Sir valus measurement methodology Min Cash Level 1: U.S. Treasury securties Level 2: Commercial paper and bonds Money market funds Time deposits US Agency securities Total Level 2 TOTAL 2020 FORM 10-K 70 Table of Contents (Donos Cash Level 1: U.S. Treasury secuies Level 2: Commercial paper and bonds Money market funds Time deposits U.S. Agency securities Total Level 2 TOTAL $ 5 $ 5 ASSETS AT FAIR VALUE 596 S $ 1.204 32 5.973 981 7 6.987 8,787 ASSETS AT FAIR VALUE 853 $ 347 $ 34 1.637 1.791 3.463 4,883 S $ MAY 31, 2020 CASH AND EQUIVALENTS MAY 31, 2019 606 $ 800 = 5,573 979 6.962 8,348 $ CASH AND EQUIVALENTS 853 $ 200 1 1.637 1.775 3,413 4.488 5 $ SHORT-TERM INVESTMENTS 404 As of May 31, 2020, the Company held $396 milion of available-for-sale debt securities with maturity dates within one year and $43 million with maturity dates over one year and less than five years in Short-term investments on the Consolidated Balance Sheets. The fair value of the Company's available-for-sale debt secu accroximates their amortized cost 32 2 1 35 439 SHORT-TERM INVESTMENTS 147 33 15 1 50 197 GROSS MARGIN FISCAL 2020 COMPARED TO FISCAL 2019 For fiscal 2020, our consolidated gross profit decreased 7% to $16.241 million compared to $17,474 million for fiscal 2019, which was significantly impacted by lower shipments to our wholesale customers and store closures within our NIKE Direct operations due to COVID-19. Gross margin decreased 130 basis points to 43.4% for fiscal 2020 compared to 44.7% for fiscal 2019 due to the following 1.5 (1.4) 44 42 44.7 TIE NEBRAND KEBANG MERAZE SELLING PRACTCOSTS PRETO INTERN in Demand creation experse11 Operating overhead expense Total saling and administrative expense % of revenues (0,40 L FORD CURRENCY AGE RATES HEDGES 0.2 D Other income) uspense, nel OFF-PROP (0.1) HAT DERET (1.1) NE OTHER COSTS 43.4 W! Higher product costs were in part due to increments tarifs in North America. Higher other coets, primarily in the fourth quarter of fiscal 2020 due to the impacts of COVID-19. were specifically related to increased factory cancellations coets higher inventory obsolescence and the adverse rate impact of supply chain costs on a lower volume of wholesale shipments TOTAL SELLING AND ADMINISTRATIVE EXPENSE P 3 FISCAL 2020 $ FISCAL 2019 3.502 S $ 9534 13.126 S $ 36.1 % Demand se can afscharthing was presenten czateng ab of conte, complay procker aber chaand prot meventing and manaf ala branat prost FISCAL 2020 COMPARED TO FISCAL 2019 Domand creation expense decreased 4% for fiscal 2020 compared to fiscal 2019, due to lower retall brand presentation costs and lower sports marketing investments, as well as decreased advertising and marketing expenses as sporting events were postponed or canceled and a majority of stores were closed globally during the fourth quarter of facal 2020. The decreases were partially offset by higher digital brand marketing costs. Changes in foreign cumancy exchange rates decreased Demand creation expansa by approximately 2 percentage points for facal 2020 % CHANGE 3,753 8,949 12,702 32.5% -4% 3 7% 3% 3 FISCAL 2020 FISCAL 2018 260 bps 3.577 7,934 11,511 FISCAL 2019 % CHANGE 31.6% Operating overhead expense increased 7% for fiscal 2020 compared to fiscal 2019, driven by higher wage-related and administrative expenses to support our continued investments in end-to-end digital capabilities, including support for a new enterprise resource planning tool Operating overhead expense was further impacted by higher bad debt expense recognized during the fourth quarter of fiscal 2020 due to the impacts of COVID-19. These increases were partially offset by lower travel and related spend. Changes in foreign currency exchange rates decreased Operating overead expanse by approximately 1 percentage points for fiscal 2020. OTHER (INCOME) EXPENSE, NET 5% 13% 10% 90 bps FISCAL 2018 139 $ (78) $ 66 Omar (income) expense, not comprises foreign currency conversion gains and losses from the re-measurement of manetary assets and liabilties denominated in non-functional currencies and the impact of certain foreign currency derivative Instruments, as well as unusual or non-operating transactions that are outside the normal course of business NOTE 4 - IDENTIFIABLE INTANGIBLE ASSETS AND GOODWILL Identifiable intangible assets, net consist of indefinite-lived trademarks, acquired trademarks and other intangible assets. The following table summarizes the Company's Identifiable intangible assets, net balances as of May 31, 2020 and 2019: (Dollars in millions) Indefinite-lived trademarks $ GROSS CARRYING AMOUNT 246 47 293 2020 ACCUMULATED AMORTIZATION $ - 19 19 $ NET CARRYING AMOUNT 246 28 274 $ MAY 31, $ GROSS CARRYING 2019 AMOUNT ACCUMULATED AMORTIZATION 281 $ 22 303 $ Acquired trademarks and other $ $ $ IDENTIFIABLE INTANGIBLE ASSETS, NET Goodwill was $223 million and $154 million at May 31, 2020 and 2019, respectively and there were no accumulated impairment losses as of May 31, 2020 and 2019. Additionally, the impact to Goodwill during fiscal 2020 and 2019 as a result of acquisitions and divestitures was not material. - 20 20 $ $ NET CARRYING AMOUNT 281 2 283 INCOME TAXES FISCAL 2020 12.1% FISCAL 2019 16.1% % CHANGE (400) bps FISCAL 2018 55.3% Effective tax rate FISCAL 2020 COMPARED TO FISCAL 2019 Our effective tax rate was 12.1% for fiscal 2020, compared to 16.1% for fiscal 2019 due to increased benefits from discrete items such as stock-based compensation. Our effective tax rate for fiscal 2018 reflected significant changes related to the enactment of the U.S. Tax Cuts and Jobs Act (the "Tax Act"). Refer to Note 9 Income Taxes in the accompanying Notes to the Consolidated Financial Statements for additional information on the impact of the Tax Act. % CHANGE (3,920) bps NOTE 2 - INVENTORIES Inventory balances of $7,367 million and $5,622 million at May 31, 2020 and 2019, respectively, were substantially all finished goods. NOTE 3 — | Property, plant and equipment, net included the following: (Dollars in millions) Land and improvements PROPERTY, PLANT AND EQUIPMENT Buildings Machinery and equipment Internal-use software Leasehold improvements Construction in process I Total property, plant and equipment, gross Less accumulated depreciation TOTAL PROPERTY, PLANT AND EQUIPMENT, NET Capitalized interest was not material for the years ended May 31, 2020, 2019 and 2018. $ $ 2020 MAY 31, 345 2,442 2,751 1,483 1,554 1,086 9,661 4,795 4,866 $ $ 2019 329 2,445 2,726 1,609 1,563 797 9,469 4,725 4,744 SELECTED QUARTERLY FINANCIAL DATA (UNAUDITED) (In millions, except per share data) Revenues(1) Gross profit Gross margin(1) Net income (loss)(1) Earnings (loss) per common share: Basic Diluted Weighted average common shares outstanding Diluted weighted average common shares outstanding Cash dividends declared per common share $ 1ST QUARTER 2020 10,660 $ 4,871 45.7% 1,367 0.87 0.86 1,562.4 1,597.5 2019 9,948 4,397 44.2% 1,092 0.69 0.67 1,594.0 1,634.4 $ 2ND QUARTER 2020 10,326 $ 4,544 44.0% 1,115 0.71 0.70 1,560.6 1,594.4 2019 9,374 $ 4,105 43.8% 847 0.54 0.52 1,581.4 1,620.7 3RD QUARTER 2020 10,104 $ 4,473 44.3% 847 0.54 0.53 1,556.3 1,591.6 2019 9,611 4,339 45.1 % 1,101 0.70 0.68 1,572.8 1,609.6 $ 4TH QUARTER 2020 6,313 $ 2,353 37.3% (790) (0.51) (0.51) 1,555.7 1,555.7 2019 10,184 4,633 45.5% 989 0.63 0.62 1,570.2 1,607.5 0.22 0.20 0.245 0.22 0.245 0.22 0.245 0.22 (1) The third and fourth quarters of fiscal 2020 reflect the impacts of COVID-19 on our results of operations and financial condition. Refer to Item 7. Management's Discussion and Analysis of Financial Condition and Results of Operations for additional information. RESULTS OF OPERATIONS (Dollars in millions, except per share data) Revenues(1) Cost of sales Gross profit Gross margin(1) Demand creation expense Operating overhead expense Total selling and administrative expense % of revenues Interest expense (income), net Other (income) expense, net Income before income taxes Income tax expense(2) Effective tax rate $ $ $ FISCAL 2020 37,403 $ 21,162 16,241 43.4% 3,592 9,534 13,126 35.1% 89 139 2,887 348 12.1% 2,539 1.60 $ $ FISCAL 2019 39,117 21,643 17,474 44.7% 3,753 8,949 12,702 32.5% 49 (78) NET INCOME(1) Diluted earnings per common share (1) Fiscal 2020 reflects the impacts of COVID-19 on our results of operations. Refer to discussion of our results below for additional information. (2) Fiscal 2018 reflects the impact from the enactment of the U.S. Tax Cuts and Jobs Act. Refer to Note 9 Income Taxes in the accompanying Notes to the Consolidated Financial Statements for additional information. 4,801 772 16.1% 4,029 2.49 % CHANGE -4 % $ -2% -7% -4% 7% 3% -40% -55 % -37% $ -36% $ FISCAL 2018 36,397 20,441 15,956 43.8% 3,577 7,934 11,511 31.6% 54 66 4,325 2,392 55.3% 1,933 1.17 % CHANGE 7% 6% 10% 5% 13% 10% 11% -68 % 108 % 113 % REVENUES Coas NIKE, Inc. Revenues: NIKE Brand Revenues by: Footw Apparel Equipment Global Brand Division Total NIKE Brand Revenues Converse Corporate TOTAL NIKE, INC. REVENUES Supplemental NIKE Brand Revenues Details: NIKE Brand Revenues by: Sales to Wholesale Customers Sales through NIKE Direct Global Brand Divisional TOTAL NIKE BRAND REVENUES NIKE Brand Revenues on a Wholesale Equivalent Basis) Sales to Wholas Customers Sales from our Whoksaa Operations to NIKE Direct Operations TOTAL NIKE BRAND WHOLESALE EQUIVALENT REVENUES NIKE Brand Wholesale Equivalent Revenues by:11) Men's Women's NIKE Kids Other TOTAL NIKE BRAND WHOLESALE EQUIVALENT REVENUES NIKE Brand Wholesale Equivalent Revenues by:1¹) Running NIKE Basketbal Jorcan Brand Football (eccer) Training Sporzs $ --- - $ $ FISCAL 2020 $ SofM-GAAP Fec 23,305 10,953 1,280 30 35,568 1,845 S (11) 37,403 $ 23,156 S 12,382 30 35,568 S $ S 23,156 s 7,452 30,60B S 16.684 S 6,999 5.033 1,882 30.608 S 3,830 S 1,509 3.609 FISCAL 2019 1,575 2,888 12,285 5,113 30.608 S foarte tation 24,222 11,550 1,404 42 37,218 1,906 (7) 39,117 25,423 11.753 42 37,218 25,423 7,127 32,550 17,737 7,380 5.283 2,150 32,550 4,488 1,597 3,138 1,094 3.137 12.442 5,854 32,550 % CHANGE -4% -5% -9% -29% 4% -3% - -4% -9% 5% -29% -0% 5% -6% 5% -5% -5% -12% -6% -15% 5% 15% -17% -14% -1% -13% -6% Other TOTAL NIKE BRAND WHOLESALE EQUIVALENT REVENUES The peat change cu cuency changes and the son of a momeet-GAAP (2) Guess prato KE era ang bawal are not sofa geograpat uporakingga! Carpacaso revenues priory concior of fage surassy hago game and looses related to generated by ass who E Brand googrows opged Covero dut managed trough our cerealforej dekagerist management program % CHANGE EXCLUDING CURRENCY CHANGES -2% 3 -3% -8% -25% -2% -1% -2% $ -7% $ 8% -25% -2% $ -7% $ 7% -4% 5 4% $ -3% -3% -10% -4% $ 12% $ 4% 15% -14% -13% 1% -10% -4% $ FISCAL 2018 22,288 10,733 1,396 88 34,485 1,895 25 36,397 23,969 10,428 89 34,485 23,969 6,332 30,301 10,690 6,813 4.906 1,784 30,301 4,495 1,494 2,858 2,145 3,126 10,720 5483 30,301 % CHANGE 9 % 8% 1 % -52 % 8 % 1 % 7% 6% "ר. 13 % -52 % A% 13 % 7% 6% 7% 8% 21 % 7% ON 7% 2 10 % -12 % 0% 18 % 7% 7% % CHANCE EXCLUDING CURRENCY CHANGES!! 12 % 11 % 4 % -63 % 11 % 3% 11 % 10 % 16 % -63 % 11 % 10 % 16 % 11 % 10% 11 % 11 % 25 % 11 % 4% 9 % 12 % -6% 3% 21 % 9% 11 % ↑ The breakdown of revenues is as follows: (Dollars in millions) North America Europe, Middle East & Africa Greater China Asia Pacific & Latin America Global Brand Divisions(2) TOTAL NIKE BRAND Converse Corporate(3) $ Europe, Middle East & Africa Greater China FISCAL 2020 $ Asia Pacific & Latin America Global Brand Divisions TOTAL NIKE BRAND(1) Converse Corporate TOTAL NIKE, INC. EARNINGS BEFORE INTEREST AND TAXES(1) Interest expense (income), net TOTAL NIKE, INC. INCOME BEFORE INCOME TAXES (1) Total NIKE Brand EBIT and Total NIKE, Inc. EBIT represent non-GAAP financial measures. See "Use of Non-GAAP Financial Measures" for further information. 14,484 9,347 6,679 5,028 $ 30 35,568 1,846 (11) 37,403 $ $ FISCAL 2019 FISCAL 2020 TOTAL NIKE, INC. REVENUES $ (1) The percent change excluding currency changes represents a non-GAAP financial measure. See "Use of Non-GAAP Financial Measures" for further information. (2) Global Brand Divisions revenues are primarily attributable to NIKE Brand licensing businesses that are not part of a geographic operating segment. (3) Corporate revenues primarily consist of foreign currency hedge gains and losses related to revenues generated by entities within the NIKE Brand geographic operating segments and Converse, but managed through our central foreign exchange risk management program. The primary financial measure used by the Company to evaluate performance of individual operating segments is EBIT, which represents Net income before Interest expense (income), net and Income tax expense in the Consolidated Statements of Income. As discussed in Note 17- Information in the accompanying Notes to the Consolidated Financial Statements, certain corporate costs are not included in EBIT of our operating segments. The breakdown of earnings before interest and taxes is as follows: (Dollars in millions) North America 2,899 1,541 2,490 1,184 (3,468) 4,646 15,902 9,812 6,208 5,254 42 37,218 1,906 297 (1,967) 2,976 89 2,887 39,117 (7) $ $ % CHANGE -9% -5% 8% -4% -29% -4% -3% FISCAL 2019 -4% % CHANGE EXCLUDING CURRENCY CHANGES(1) 3,925 1,995 2,376 1,323 (3,262) 6,357 303 (1,810) 4,850 49 4,801 -9% $ -1 % 11% 1% -26% -2% -1% -2% $ FISCAL 2018 % CHANGE -26% $ -23% 5% -11% -6 % -27% -2% -9% -39% -40% 14,855 9,242 5,134 5,166 88 34,485 1,886 26 36,397 $ FISCAL 2018 % CHANGE 7% 6% 21% 2% -52 % 8% 1% 3,600 1,587 1,807 1,189 (2,658) 5,525 310 (1,456) 4,379 54 4,325 7% % CHANGE EXCLUDING CURRENCY CHANGES(1) Operating Segments and Related 7% 11 % 24% 13% -53 % 11% 3% 11% % CHANGE 9% 26 % 31% 11% -23% 15% -2% -24% 11% 11 % OFF-BALANCE SHEET ARRANGEMENTS In connection with various contrads and agreements we routinely provide indemnification relating to the enforceability of intelectual property rights, coverage for legal issues that arise and other iteme where we are acting as the guarantor. Currently, we have several such agreements in place. Based on our historical experience and the estimated probability of future loss, we have determined that the fair value of such incemnification is not material to our financial position or results of operations. CONTRACTUAL OBLIGATIONS Our significant long-term contractual obligations of May 31, 2020, and significant endorsement contracts, including related marketing commitments, entered into through the date of this report are sa loikowa: DESCRIPTION OF COMMITMENT Ded Operating Lesses Long-Term Deb Endorsement Contract21 Product Purchase Obligations Other Purwaa Obligadona) Transition Tax Related to the Tax Act TOTAL Table of Contents 3 123 14 5 2021 550 $ 289 1,330 4.234 1,085 86 7,574 S 2022 514 S 288 1471 345 26 2,702 $ CASH PAYMENTS DUE DURING THE YEAR ENDING MAY 31, 2023 2024 2025 156 $ 788 1,178 180 86 2,695 $ 416 S 275 1,064 <- - 2,052 S and The aparate de Ar knyg-debate of paymenteradorastenagamint azokoratyvareofy 31, 2020, nga bu for wabament corresterpass approaste of ORDONANÍ AKI FUNT wanywa mare obligated to pay alsak, potes igua, portando as of our products. Act and as a constatay be trghar han chu 138 161 374 3 1,275 1,135 - 127 215 3,126 5 bas THEREAFTER 1,474 3 11,541 3184 $ - 345 268 16,792 $ TOTAL tort pa a att ha ow conta prowl for bossases to be part to the anche bassapon beachar on prockets are parte. Achapas och some chats may abo de ras those casas ble prova foduced pagmente ale pemance de sch vi nch payments as an ato pverite vas not poslendeve spend on this move on natru a a the acts protect of cheap an the product. The amount of producted to the chowan my fan con the branding new they panduan de gardigandingkation, the conte i deg, de and puchon the potete fted in the endexare ced curand of cry fracid cynchtete cued fr er product a four mon based primary rackard credeam whose cars and demas com our direct de convergence for product pero congadbro raprasane agroasanta cat open purchase ora lo purchase produce he orary coace of an and bay arong and typese, possuto change troughout the prote and assesse et abors conducta, mada é de ordinary cow of business Toursors de santan papowtarqawwalby bylydning us Ropretro cast paymes ale as part of the ono os dono pasiason of indistato narasgo of Rugn satokkares www is rostos not of foreign to oredowed Roky 10 Moto9 Too in tamang Notes to the Consoldred Fisch In addition to the above, we have long term obligations for uncertain tax positions and various post retirement benefits for which we are not able to reasonably estimate when cash payments will cocur. Refer to Note 9 Income Taxes and Note 13-Benett Plans in the accompanying Notes to the Consolidated Financial Statements for further information related to uncertain tax positions and post-ratiramas benafts, respectively auguhnu primary sources and any conversa aruding prod. and woments that any al ajrakurs' Avera, and may inche pas pushasa waara for non- for donanmasion. 3,784 14.452 9342 4.294 2227 502 34,941 2020 FORM 10-45 We also have the following outstanding short term debt obligations as of May 31, 2020. Refer to Note 7 Short-Term Borrowings and Credit Lines in the accompanying Notes to the Consolidated Financial Statements for further description and interest rates related to the short term debt obligations listed below. D AS OF MAY 31, 2020 Notes payable, dua at mutually agreed-upon dates within one year of issuance or on demand As of May 31, 2020, we had bank guarantees and letters of credit outstanding totaling $239 million, issued primarily for real estate agreements, self-insurance programs and other general business obligations. 740 As of May 31, 2020, the Company held $396 million of available-for-sale det seour ties with maturity dates within one year and $43 million with maturity dates over ane year and less than five years in Short-term kovostments on the Consalidated Balance Shoots. The fair value of the Company's available-for-sale debt securities approximate their amortized cont Included in Interest expense (incomel, net was interest Income related to the Company's Investment portfolio of $82 milion, $82 milion and $70 million for the years ended May 31, 2020, 2019 and 2018, respectively The Company elects to record the grass assets and abilities of its derivative financial instruments on the Consolidated Balance Sheets. The Company's derivative financial instruments are subject to master nating amangements that allow for the offset of assets and liabilities in the event of default or early termination of the contract. Any amounts of cash collateral received related to these instruments associated with the Company's credit-related contingent features are recorded in Cash and equivalents and Accrued Nabines, the latter of which would further offset against the Company's derivative asset barance. Any amounts of cash colateral posted related to those instruments associated with the Company's credit-related contingent features are recorded in Propaid expenses and other cument assots, which would further offset against the Company's derivative labilly balance. Cash colateral received or posted related to the Company's credit related contingent features is presented in the Cash provided by operatione component of the Consolidated Statements of Cseh Flows. Any amounts of non-cash collateral received, such as securities, are not recorded on the Corsoidsted Balance Sheets pursuant to US GAAP. For further information related to credit risk, refer to Note 14-Risk Management and Derivatives. The following tables present information about the Company's derivative assets and abilities measured at fair value on a recurring basis as of May 31, 2020 and 2019 and indicate the level in the fair value hierarchy in which the Company classifies the fair value measurement. MAY 31, 2020 Der Level 2 Foreign excharge forwards and opens) Embedded derivatives TOTAL Table of Contents (Dolors) Level 2: Foreign exchange forwards and options() Embedded derivatives TOTAL $ $ ASSETS AT FAIR VALUE 205 $ 2 207 $ ostage des adm.Dohor Baby Shows, the candy pastors would be used by 57631, 2009 Ashant cash card orded on the stand outsily to the Agg. $ 94 $ 1 95 S ASSETS AT FAIR VALUE DERIVATIVE ASSETS OTHER CURRENT ASSETS 611 S 11 822 S 91 S $ 1 92 $ DERIVATIVE ASSETS OTHER CURRENT ASSETS OTHER LONG-TERM ASSETS 811 s 5 616 S 3 OTHER LONG-TERM ASSETS $ (targe davale val's had boom te onte Corsaed Sabrev Shovia, he aandky poador east would be reduced by or as May 21, 2015). As u hacke the Company has recewed 2 men oca cara Company debaty b 4, 2 No transfers among the levels within the fair value hierarchy occurred during the years ended May 31, 2020 or 2018. $ MAY 31, 2019 5 6 $ LIABILITIES AT FAIR VALUE $ DERIVATIVE LIABILITIES ACCRUED LIABILITIES LIABILITIES AT FAIR VALUE 188 $ 2 190 $ DERIVATIVE LIABILITIES ACCRUED LIABILITIES 51 $ 1 52 $ OTHER LONG-TERM LIADILITIES 17 17 2020 FORM 10-K 71 51 $ 3 $ 54 $ aber couragperdas ded fragen stage descriwww.post. OTHER LONG-TERM LIABILITIES 2 NON-RECURRING FAIR VALUE MEASUREMENTS As further discussed in Nota 20- Acquisitions and Diveatures, the Company met the criteris to recognize the related assets and Eshillies of in Brazi, Argentina, Chile and Uruguay enties as held-forase in the third quarter of facal 2020 and the dessification of the belancas namain as such as of May 31, 2020. This required the Company to remeasure the disposal groups at far value, less costs to sell, which is considered a Level 3 tair value measurement and was based on each transaction's estimated consideration at the date of close. The carrying value of the Argentina. Chile and Uruguay disposal groups exceeded their fair value, less costs to sal and as a result, the Company recognized a non-recurring impairment charge of $400 million. This charge was primarily due to the anticipated release of non-cash cumulative foreign currency translation losses which ware included as part of the carrying value of the Argentina, Chis and Uruguay disposal groups when measuring for impairment. For the fiscal year ended May 31, 2020, the charge was recognized in Other (income) expense, net on the Consolidated Statements of Income classified within Corporate, and a corresponding alowance within Accrued Liabies on the Consolicated Balance Sheets. All other assets or abilities required to be measured at fair value on a non-recuming basis as of May 31, 2020 were immaterial As of May 31, 2019, all assets or liabilities required to be measured at fair value on a non-recurring basis were immaterial. 2020 FORM 10-K 72 Table of Contents >1 NOTE 7 - SHORT-TERM BORROWINGS AND CREDIT LINES 1 Notas payable as of May 31, 2020 and 2019 are summarized below: D Moters pybe Commercial papen!) US opsestions Non-U.S. operations TOTAL NOTES PAYABLE Compane berge with a greater the marched Procock fromagnetof de leevence sex on the Castle of Ca $ $ BORROWINGS 248 E 248 2020 MAY 31 INTEREST RATE 1.66% 0.00% 0.00% $ $ BORROWINGS - 2 9 2019 INTEREST RATE acns 0.00% 12 25.00% (2) Modamage ostaldoonoring arrats The carrying amounts reflected in the Consolidated Balance Sheets for Notes payable approximate fair value. On August 16, 2019., the Compeny entered into a committed credit facility agreement with a syndicate of banks which provides for up to $2 bilion of borrowings, with the option to increase borrowings up to $3 billion in total upon lender approval The facility matures un Auguel 16, 2024, with a one your extension option prior to any anniversary of the closing date, provided that in no event shall it extend beyond August 15, 2026. Based on the Company's current long term senior unsecured debt ratings of AA and A1 from Standard and Poor's Corporation and Moody's Investor Services, respectively, the interest rate charged on any outstanding borrowings would be the prevailing LIBOR pus 0.46%. The facility fea is 0.04% of the total commitment. This facility replaces the prior $2 billion credit facility agrement entered into on August 28, 2015, which would have matured August 28, 2020. As of and for the periods ended May 31, 2020 and 2019, no amounts were outstanding under either committed credit facility. On April 5, 2020, the Company entered into a commited credit facility agreement with a syndicate of banks which provides for up to $2 billion of borrowings, in addition to the existing credit facility discussed above. The new facility matures on April 5, 2021. Based on the Company's current long-term senior unsecured cebt ratings of AA-and A1 from Standard and Poor's Corporation and Moody's Investor Services, respectively, the interest rate charged on any outstanding borrowings would be the prevailing LIBCR pka 1.05%. The facility fee is 0.20% of the total commitment. As of May 31, 2020 no amounts were outstanding under this commilled c facility. ↑ NOTE 8 - LONG-TERM DEBT •1 Long term debt net of unamortized premiums, ciscounts and debt issuance costs, comprises the following: Scheed Monty (Dolars and ten in milons) Corporate Term Debc12 May 1, 2023 March 27, 2025 November 1, 2026 March 27, 2027 March 27, 2030 March 27, 2040 May 1, 2043 November 1, 2045 November 1, 2048 March 27, 2060 Japanese Yer Notes August 20, 2001 through November 20, 2020 August 20, 2001 through November 20, 2020 Total Less current matunities TOTAL LONG-TERM DEBT 1 $ V ORIGINAL PRINCIPAL 500 1,000 1,000 1,000 1,500 1,000 500 1,000 500 1,500 9,000 4,000 INTEREST RATE (MELNOSumeda (al of #136 AWonin basa ate part in the spowerment to purchas a datbler oder in Apur, mezi 200 as confort The scheduled maturity of Long-term debt in each of the years ending May 31, 2021 through 2025 are $3 milion. $0 milon, $500 milion, 50 milion and $1,000 milion, respectively, at face value. 2.25% 2.40% 2.38% 2.75% 2.85% 3.25% 3.83% 3.88% 3.30% 3.38% 2.80% 2.00% kata mutru in aqualquariaty itatabores dating the period August 20, 2007 through forever 21, 2009 INTEREST PAYMENTS Semi-Annusly Semi Annualy Semi-Armusly Semi-Annualy Semi-Arnusly Semi-Annualy Semi-Arnusly Semi-Annualy Semi-Arnualy Semi-Annualy Quarterly Quarterly $ $ $ BOOK VALUE OUTSTANDING AS OF MAY 31, 2020 499 $ 994 995 994 1,489 985 495 984 491 1,480 2 $ 1 9,409 3 9,406 $ 2019 498 De 994 = 3 495 983 491 (Thessarecured person with the Company's oeteruenced and u at presque ton onder of (2) The Company 100% of the aggregate score of the acts to be seed or there of the meets the secteued parents, phuc in each case, and an apa wae abarca per a protes which the hondenberedared at a price ajun 75% of age and out of the roses buing redused. Dus v and paid oor der do Far Ca? Dutu s obfred in the respective na 6 3 3.470 6 3,464 The Company's long-term debt is recorded at adjusted cost, net of unamortized premiums, discounts and debt issuance costs. The fair value of long-term debt is estimated based upon cuoted prices for similar instruments or quoted prices for identical instruments in inactive markets (Level 2). The fair value of the Company's long- term debt, including the current portion, was approximately $10.545 million at May 31, 2020 and $3,524 million at May 31, 2019. 2020 FORM 10-K 74 ↑ ✔ NOTE 9 - INCOME TAXES income before income taxes is as follows: (Dos Income before income taxes: United States Foreign TOTAL INCOME BEFORE INCOME TAXES •1 The provision for income taxes is as follows (D Current United States Federal Stala Foreign Total Cament Deferred United States Federal State Foreign Total Deferred TOTAL INCOME TAX EXPENSE $ $ $ $ 2020 2020 2,954 $ (67) 2,887 $ (109) $ 81 756 728 (231) (47) (102) (380 348 $ YEAR ENDED MAY 31, 2019 593 4,208 4,001 $ 3 YEAR ENDED MAY 31, 2019 74 $ 56 608 735 (33) (9) 76 34 7TZ $ 2018 2018 744 3.581 4,325 1.167 45 533 1.745 380 25 27 647 2.392 1 On December 22, 2017, the US enacted the Tax Cuts and Jobs Act (The "Tax Act") which sicnificantly changed previous U.S. ax laws, including a reduction in the corporate tax rate from 35% to 21% and a one-time transition tax on deemed repatriation of undistributed foreign eamings. For fecal 2018 the change in the corporale tax rate resulted in a blended U.S. federal statutory rate for the Company of approximately 29% As of May 31, 2020 and 2018, long-term income taxes payable were $757 milion and $902 milion, respectively, and were included within Deferred income tases and other assets on the Consolidated Balance Sheels A reconciliation from the U.S. statutory federal income tax rate to the effective income tax rate is as follows: Federal income tax rate State taxes, net of federal benefit Foreign earnings Foreign-derived intangible income benefit related to the Tax Act Transition tax related to the Tax Act Remeasurement of deferred tax assets and liabilities related to the Tax Act Excess tax benefits from share-based compensation Income tax audits and contingency reserves U.S. research and development tax credit Other, net EFFECTIVE INCOME TAX RATE 2020 Table of Contents 21.0% 0.8% 5.9% -8.1 % % -% -7.2 % -1.4% -1.8% 2.9% 12.1% YEAR ENDED MAY 31, 2019 21.0% 1.0% -1.1% % % % -3.6% 1.3% -1.0% -1.5% 16.1% 2018 29.2 % 0.8% -19.2% - % 43.3% 3.7 % -5.3% 2.9 % -0.6% 0.5% 55.3% | The effective tax rate for the fiscal year ended May 31, 2020 was lower than the effective tax rate for the fiscal year ended May 31, 2019 due to increased benefits from discrete items such as stock-based compensation. The foreign earnings rate impact shown above for the fiscal year ended May 31, 2020 includes withholding taxes of 6.5% and held for sale accounting items of 2020 FORM 10-K 75 2.9%, offset by a benefit for statutory rate differences and other items of 3.5%. The foreign derived intangible income benefit reflects U.S. tax benefits introduced by the Tax Act for companies serving foreign markets. This benefit became available to the Company as a result of a restructuring of its intellectual property interests. Income tax audit and contingency reserves reflect benefits associated with the modification of the treatment of certain research and development expenditures of 2.9% offset by an increase related to the resolution of an audit by the U.S. Internal Revenue Service ("IRS") and other matters of 1.5%. Included in other is the deferral of income tax effects related to intra-entity transfers of inventory of 2.3% and other items of 0.6%. The effective tax rate for the year fiscal ended May 31, 2019 was lower than the effective tax rate for the fiscal year ended May 31, 2018 due to significant changes related to the enactment of the Tax Act in fiscal year 2018 and reduction in the U.S. federal statutory rate to 21% in fiscal year 2019. Deserba wk SupOS SYN INCITES Comprise the following 35 or sil Deferred tax Inventaries Sales return reserves Deferred compensation Stock-based compensation Reserves and accrued liabilities Operating lease labites Capitalized research and development expancituras Net operating loss carry-forwards Other Total deferred tax assets Valuation allowanc Total deferred tax assets after valuation allowance Deferred tax liabilities: Foreign withholding tax on und stributed earnings of foreign subsidiaries Property, plant and equipment Right-of-use assets Other Total defamed tax liabilities NET DEFERRED TAX ASSET casino Unrecognized benefits, beginning of the period 1 The above amounts exclude deferred taxes of the Company's Brazil Argentina, Chile and Uruguay operations which are classified as held for sale on the Consolidated Balance Sheets as of May 31, 2020. See Note 20-Acquistions and Divestmures for additional information. -1 The following is a reconciliation of the changes in the gross balancs of unrecognized fac benelts as of Gross Increases related to prior period tax positions Gross decress related to prior period tax postiona Gross Increases related to current period tax postions Settlements Lapse of statute of Imitations Chenges due locumency translation UNRECOGNIZED TAX BENEFITS, END OF THE PERIOD 3 $ 2020 $ (171) czy 50 $ 808 $ 181 (58) (28) (11) 771 $ 2020 MAY 31, 2019 MAY 31. *²*385352201 1000** 84 116 296 166 491 (26) (165) (232) (423) (32) (852) S 732 5 $ 698 $ 86 (32) 81 (36) 11 808 $ 2019 2018 AA 128 271 156 101 - 81 125 928 (88) 840 (235) (189) (41) (484) 376 481 19 (12) 249 (20) 1 698 The Company recognizes interest and penalties related to income tax matters in income tax expense. The liability for payment of interest and penalties decreased by $16 million during the year ended May 31, 2020, increased by $17 million during the fiscal year ended May 31, 2019 and decreased by $14 million during the fiscal year ended May 31, 2018. As of May 31, 2020 and 2019, accrued interest and penalties related to uncertain tax positions were $158 million and $174 million, respectively (excluding federal benefit). The Company is subject to taxation in the United States, as well as various state and foreign jurisdictions. The Company is currently under audit by the IRS for fiscal years 2017 through 2019. The Company has closed all U.S. federal income tax matters through fiscal 2016, with the exception of certain transfer pricing adjustments. Tax years after 2009 remain open in certain major foreign jurisdictions. Although the timing of resolution of audits is not certain, the Company evaluates all domestic and foreign audit issues in the aggregate, along with the expiration of applicable statutes of limitations, and estimates that it is reasonably possible the total gross unrecognized tax benefits could decrease by up to $50 million within the next 12 months. In January 2019, the European Commission opened a formal investigation to examine whether the Netherlands has breached State Aid rules when granting certain tax rulings to the Company. The Company believes the investigation is without merit. If this matter is adversely resolved, the Netherlands may be required to assess additional amounts with respect to current and prior periods, and the Company's Netherlands income taxes in the future could increase. The Company historically provided for U.S. income taxes on the undistributed earnings of foreign subsidiaries unless they were considered indefinitely reinvested outside the United States. As a result of the enactment of the Tax Act, in fiscal 2018 the Company reevaluated its historic indefinite reinvestment assertion and determined that any historical or future undistributed earnings of foreign subsidiaries are no longer considered to be indefinitely reinvested. Effective January 1, 2020, however, the tax law in the Netherlands, one of the Company's major jurisdictions, changed. As a result of the change in law, the Company's undistributed earnings in the Netherlands are subject to withholding tax upon distribution. It is the Company's intention to indefinitely reinvest the historical earnings of its foreign subsidiaries outside North America prior to May 31, 2020 to ensure there is sufficient working capital to expand operations outside the United States. Accordingly, the Company has not recorded a deferred tax liability related to foreign withholding taxes on approximately $8.1 billion of undistributed earnings of these foreign subsidiaries as of May 31, 2020. Withholding taxes of approximately $1.2 billion would be payable upon the remittance of these undistributed earnings as of May 31, 2020. A portion of the Company's foreign operations benefit from a tax holiday, which is set to expire in 2021. This tax holiday may be extended when certain conditions are met or may be terminated early if certain conditions are not met. The tax benefit attributable to this tax holiday was $238 million, $167 million and $126 million for the fiscal years ended May 31, 2020, 2019 and 2018, respectively. The benefit of the tax holiday on diluted earnings per common share was $0.15, $0.10 and $0.08 for the fiscal years ended May 31, 2020, 2019 and 2018, respectively. Deferred tax assets at May 31, 2020 and 2019 were reduced by a valuation allowance. For the fiscal year ended May 31, 2020, a valuation allowance was provided for U.S. foreign tax credit carry-forwards and on tax benefits generated by entities with operating losses. For the fiscal year ended May 31, 2019, the valuation allowance provided primarily related to tax benefits generated by certain entities with operating losses. There was a $62 million net decrease in the valuation allowance for the fiscal year ended May 31, 2020, compared to a $7 million net decrease for the fiscal year ended May 31, 2019, and $13 million net increase for the year ended May 31, 2018. The decrease in the Company's net valuation allowance for the fiscal year ended May 31, 2020 is primarily related to the classification of the Company's Brazil and Argentina operations as held-for-sale on the Consolidated Balance Sheets as of May 31, 2020. See Note 20- Acquisitions and Divestitures for additional information. The Company has recorded deferred tax assets of $15 million at May 31, 2020 for U.S. foreign tax credit carry-forwards which will begin to expire in 2030. -| The Company has available domestic and foreign loss carry-forwards of $83 million at May 31, 2020. If not utilized, such losses will expire as follows: (Dollars in millions) Net operating losses $ 2021 $ 2022 3 $ 2023 2 $ YEAR ENDING MAY 31, 2024 2 $ 2025-2040 59 $ INDEFINITE 17 $ I The above amounts at May 31, 2020 exclude net operating loss carry-forwards of the Company's Brazil, Argentina and Chile operations which are included in assets held-for-sale on the Consolidated Balance Sheets at May 31, 2020. See Note 20- Acquisitions and Divestitures for additional information. TOTAL 83 NOTE 10 - REDEEMABLE PREFERRED STOCK Soitz America is the sole owner of the Company's authorized redeemable preferred stock, $1 par value, which is redeemable at the option of Soltz America or the Company at par value aggregating $0.3 milion. Acumulative dividend of $0.10 per share is payable annually on May 31 and no dividends may be declared or paid on the common stock of the Company unleas dividends on the redeemabia prefamed slack have been declared and paid in full. There have been no changes in the redeamable preferred stock in the fiscal years ended May 31, 2020, 2019 and 2018. As the holder of the redeemable preferred steck, Sojitz America does not have general voting rights, but does have the right to vote as a separate class on the sale of al or substantally all of the assets of the Company and its subsidiaries, on merger, consolidation, Iquication or dissolution of the Company, or on the sale or assignment of the NIKE trademark for athletic footwear sold in the United States. The receemable preferred stock has been fuly issued to Sojitz America and is not blank check preferred stock. The Company's articles of incorporation de not permit the issuance of additional prefamed stock NOTE 11 - COMMON STOCK AND STOCK-BASED COMPENSATION COMMON STOCK The authorized number of shares of Class A Common Stock, na par value, and Class B Common Stock, no par valve, are 400 million and 2,400 milion, respectively. Each share of Class A Commen Stock is camenible into one share of Class 8 Common Stock Veting rights of Class B Common Stock are limited in certain circumstances with respect to the election of directors. There are no differences in the dividend and liquidation preferences or participation rights of the hakers of Class A and Class B Common Stock From time to time, the Company's Board of Directors authartzes share repurchase programs for the repurchase of Class B Common Stock. The value of repurchased shares is deducted from Total shareholders' equity through allocation to Capital in excess of stated value and Retained earnings. STOCK-BASED COMPENSATION The NIKL, Inc. Stock Incentive Plan (the Stock Incentive Plan) provices for the issuance of up to 718 milion previously unissued shares of Class B Common Stock in connection with equity awards granted under the Stock Incentive Plan. The Stock Incentive Plan authorizes the grant of non-statutory stock options, incentive stock options, stock appreciation rights, restricted stock, restricted stock units and performance-based awards. The exercise price for stock options and stock appreciation rights may not be less than the fair market value of the underlying shares on the date of grant. A committee of the Board of Directors administers the Stock Incentive Plan. The commitee has the authority to determine the employees to whom awards will be made, the amount of the awards and the other terms and conditions of the awards. The Company generally grants stock options and restricted stock on an annual basis. Substantally all awards under the Stock Incentive Plan vast ratably over 4 years of continued employment, with stock options expiring 10 years from the date of grant 1 The following table summarizes the Company's total stock-based compensation expense recogrized in Cost of sales or Operating overhoed expense, as applicable: Dala Stock options ESPPS Restricted stock TOTAL STOCK-BASED COMPENSATION EXPENSE $ $ 2020 237 53 139 429 $ $ YEAR ENDED MAY 31, 2019 207 $ 40 TU 325 $ A. Exponenckatorenches the sense cted with a proshe rights Acceleated stock option expense e vecorded for mye menking atas vavimant egy vestments. Acced ek opto expresse 553 mon 541 maand 51m tor the fesi yere ended My 24, 2020 2019 and 2015 respectively The income tax benefit related to stock-based compensation expense was $207 million, $175 million and $230 million for the fiscal years ended May 31, 2020, 2019 and 2018, respectively and reported within income tax expense 2018 148 34 35 218 STOCK OPTIONS The weighted average fair value per share of the options granted during the years ended May 31, 2020, 2019 and 2018, computed as of the grant date using the Black-Scholes pricing model, was $18.71, $22.78 and $9.82, respectively. The weighted average assumptions used to estimate these fair values were as follows: YEAR ENDED MAY 31, 2019 Dividend yield Expected volatility Weighted average expected life (in years) Risk-free interest rate The following summarizes the stock option transactions under the plan discussed above: Options outstanding as of May 31, 2019 Exercised Forfeited Granted Options outstanding as of May 31, 2020 2020 1.0% 23.0% 6.0 1.5% EMPLOYEE STOCK PURCHASE PLANS Expected volatilities are based on the historical volatility of the Company's common stock, the implied volatility in market traded options on the Company's common stock with a term greater than one year, as well as other factors. The weighted average expected life of options is based on an analysis of historical and expected future exercise patterns. The interest rate is based on the U.S. Treasury (constant maturity) risk-free rate in effect at the date of grant for periods corresponding with the expected term of the options. SHARES(1) (In millions) 91.3 (20.1) (2.2) 19.1 88.1 $ 1.0% 26.6% 6.0 2.8% $ 2018 1.2% 16.4% 6.0 2.0% WEIGHTED AVERAGE OPTION PRICE 50.59 35.26 75.74 85.29 60.98 (1) Includes stock appreciation rights transactions. Options exercisable as of May 31, 2020 were 48.5 million and had a weighted average option price of $46.91 per share. The aggregate intrinsic value for options outstanding and exercisable at May 31, 2020 was $3,316 million and $2,506 million, respectively. The total intrinsic value of the options exercised during the years ended May 31, 2020, 2019 and 2018 was $1,161 million, $938 million and $889 million, respectively. The intrinsic value is the amount by which the market value of the underlying stock exceeds the exercise price of the options. The weighted average contractual life remaining for options outstanding and options exercisable at May 31, 2020 was 6.2 years and 4.5 years, respectively. As of May 31, 2020, the Company had $411 million of unrecognized compensation costs from stock options, net of estimated forfeitures, to be recognized in Cost of sales or Operating overhead expense, as applicable, over a weighted average remaining period of 2.6 years. The following summarizes the restricted stock and restricted stock unit activity under the plan discussed above: Nonvested as of May 31, 2019 Verled Fortellad Granted Nonvested as of May 31, 2020 in magpl per alste distal Net income available to common stockholders Determination of shares: Waighted average common shares outstanding Assumed conversion of dilutive stock options and awards DILUTED WEIGHTED AVERAGE COMMON SHARES OUTSTANDING Earnings per common share Basic Ciutad J 1 $ $ इ SHARES 2020 I The weighted average fair value por share of restricted stock and restricted stock units granted for the years ended May 31, 2020, 2019 and 2018, computed as of the grant date, was $88.26, $80.95, and $62.51, respectively. During the years ended May 31, 2020, 2019 and 2018, the aggregate fair value of restricted stock and restricted alock units veated was $98 million, $44 milion and $113 milion, respectively, comoded as of the date of vesting. As of May 31, 2020, the Company had $342 milice of unrecognized compensation costs from restricted stock and restricted stock unts, net of estimated forfeitures, to be recognized in Cour of sales or Operating overhead expense, as applicable, over a weighted average remaining period of 2.7 years. ►l NOTE 12- EARNINGS PER SHARE -1 The following is a reconciliation from basic eamings per common share to diluted earnings per common shere. The computations of diluted earnings per common share excluded options, including shares under ESPPs, and restricted stock to purchase an additional 20.6 milion 17.5 milion and 42.9 million shares of common stock outstanding for the fiscal years ended May 31, 2020, 2019 and 2018, respectively, because the options and restricted stock were ad-diutive. 2,539 $ 1.558.8 32.8 1,591.6 44 (1.1) (0.31 3.5 8.8 $ 1.63 $ 1.80 3 S WEIGHTED AVERAGE GRANT DATE FAIR VALUE YEAR ENDED MAY 31, 2019 4,029 S 1,579 7 38.7 1,618.4 70.93 72.64 79.62 2:06 S 2.40 S 88.26 79.84 2018 1.933 1.623.8 36.3 1.650.1 1.19 1.17 NOTE 14 RISK MANAGEMENT AND DERIVATIVES The Company is exposed to global market risks, including the effect of changes in foreign currency exchange rates and interest rates, and uses derivatives to manage financial exposures that occur in the normal course of business. The Company does not hold or issue derivatives for trading or speculative purposes. The Company may elect to designate certain derivatives as hedging instruments under U.S. GAAP. The Company formally documents all relationships between designated hedging instruments and hedged items as well as its risk management objectives and strategies for undertaking hedge transactions. This process includes linking all derivatives designated as hedges to either recognized assets or liabilities or forecasted transactions and assessing, both at inception and on an ongoing basis, the effectiveness of the hedging relationships. The majority of derivatives outstanding as of May 31, 2020 are designated as foreign currency cash flow hedges, primarily for Euro/U.S. Dollar, British Pound/Euro, Japanese Yen/U.S. Dollar and Chinese Yuan/U.S. Dollar currency pairs. All derivatives are recognized on the Consolidated Balance Sheets at fair value and classified based on the instrument's maturity date. The following tables present the fair values of derivative instruments included within the Consolidated Balance Sheets as of May 31, 2020 and 2019: (Dollars in millions) Derivatives formally designated as hedging instruments: Foreign exchange forwards and options Foreign exchange forwards and options Total derivatives formally designated as hedging instruments Derivatives not designated as hedging instruments: Foreign exchange forwards and options Embedded derivatives Foreign exchange forwards and options Embedded derivatives Total derivatives not designated as hedging instruments TOTAL DERIVATIVE ASSETS DERIVATIVE ASSETS BALANCE SHEET LOCATION Prepaid expenses and other current assets $ Deferred income taxes and other assets Prepaid expenses and other current assets Prepaid expenses and other current assets Deferred income taxes and other assets Deferred income taxes and other assets $ 2020 43 1 44 48 1 2 51 95 MAY 31, $ $ 2019 509 509 102 5 6 113 622 (Dollars in millions) Derivatives formally designated as hedging instruments: Foreign exchange forwards and options Foreign exchange forwards and options Total derivatives formally designated as hedging instruments Derivatives not designated as hedging instruments: Foreign exchange forwards and options Embedded derivatives Embedded derivatives Total derivatives not designated as hedging instruments TOTAL DERIVATIVE LIABILITIES (Dollars in millions) Revenues Cost of sales Demand creation expense Other (income) expense, net Interest expense (income), net $ 2020 FORM 10-K 82 TOTAL 37,403 21,162 3,592 139 89 The following table presents the amounts in the Consolidated Statements of Income in which the effects of cash flow hedges are recorded and the effects of cash flow hedge activity on these line items for the fiscal years ended May 31, 2020, 2019 and 2018: $ 2020 The following tables present the amounts affecting the Consolidated Statements of Income for the years ended May 31, 2020, 2019 and 2018: AMOUNT OF GAIN (LOSS) ON CASH FLOW HEDGE ACTIVITY (17) 364 (2) 181 (7) $ BALANCE SHEET LOCATION Accrued liabilities $ Deferred income taxes and other liabilities DERIVATIVE LIABILITIES Accrued liabilities Accrued liabilities Deferred income taxes and other liabilities TOTAL 39,117 21,643 3,753 YEAR ENDED MAY 31, 2019 (78) 49 $ $ AMOUNT OF GAIN (LOSS) ON CASH FLOW HEDGE ACTIVITY (5) $ 53 35 (7) 2020 173 17 190 15 2 17 207 MAY 31, TOTAL 36,397 20,441 3,577 66 54 $ $ $ 2018 2019 5 5 46 1 2 49 54 AMOUNT OF GAIN (LOSS) ON CASH FLOW HEDGE ACTIVITY 34 (90) 1 (69) (7) -1 The following table summarizes the reclassifications from Accumulated other comprehensive income (loss) to the Consolidated Statements of Income: (Dollars in millions) Gains (losses) on foreign currency translation adjustment Total before tax Tax (expense) benefit Gain (loss) net of tax Gains (losses) on cash flow hedges: Foreign exchange forwards and options Foreign exchange forwards and options Foreign exchange forwards and options Foreign exchange forwards and options Interest rate swaps Total before tax Tax (expense) benefit Gain (loss) net of tax Gains (losses) on other Total before tax Tax (expense) benefit Gain (loss) net of tax Total net gain (loss) reclassified for the period $ $ $ AMOUNT OF GAIN (LOSS) RECLASSIFIED FROM ACCUMULATED OTHER COMPREHENSIVE INCOME (LOSS) INTO INCOME YEAR ENDED MAY 31, 2020 (1) (1) (1) (17) 364 (2) 181 (7) 519 (2) 517 1 1 $ 1 517 $ 2019 (5) 53 35 (7) 76 (6) 70 RFF FE 17 17 17 87 LOCATION OF GAIN (LOSS) RECLASSIFIED FROM ACCUMULATED OTHER COMPREHENSIVE INCOME (LOSS) INTO INCOME Other (income) expense, net Revenues Cost of sales Demand creation expense Other (income) expense, net Interest expense (income), net Other (income) expense, net NOTE 16 REVENUES DISAGGREGATION OF REVENUES >I The following tables present the Company's revenues disaggregated by reportable operating segment, major product line and by distribution channel: Daterin Revan by: Footwear Apparel Equipment Other TOTAL REVENUES Revenues by: Sales to Wholesale Customers Sales through Cirect to Consumer Other TOTAL REVENUES M Revenues by: Footwear Apparel Equipment Other TOTAL REVENUES Revenues by: Sales la Wholesale Customers Sales through Direct to Consumer Other TOTAL REVENUES $ $ S $ $ $ $ $ NORTH AMERICA 9,329 4.639 016 - 14,404 $ 9,371 5,113 14.484 NORTH AMERICA 10,045 5.260 587 15.902 10.875 5.027 $ 3 5 $ 3 5 3 15,902 $ EUROPE, MIDDLE EAST & AFRICA 5,892 $ 3,053 402 = 9,347 $ 6,574 $ 2,773 9,347 EUROPE, MIDDLE EAST & AFRICA 8.293 3,087 432 9,812 7,076 2,736 5 $ $ S 9,812 $ GREATER CHINA 4,635 $ 1,895 145 - 6,679 $ 3,903 2,878 6,679 GREATER CHINA 4,262 1,808 138 8,208 3.728 2,482 $ S $ 5 S 6,208 $ ASIA PACIFIC & LATIN AMERICA 3,449 S $ 1.365 214 = 3,026 $ 3,408 $ 1,620 5,028 ASIA PACIFIC & LATIN AMERICA 3.822 1,395 237 5.254 3,748 1,608 5,254 $ 3 5 3 $ YEAR ENDED MAY 31, 2020 GLOBAL BRAND DIVISIONS - = 30 30 TOTAL NIKE BRAND = 42 42 $ = = 42 42 $ - 30 30 $ $ YEAR ENDED MAY 31, 2019 GLOBAL BRAND DIVISIONS $ $ TOTAL NIKE BRAND $ 23.306 $ 10.963 1.280 30 35,568 $ 23.156 40.100 12,382 30 35,568 24 222 11.560 1.404 42 37,218 $ S $ $ S $ 25.423 11.703 42 37 218 $ $ CONVERSE 1,642 80 20 90 1.846 CONVERSE 1,104 600 90 1,846 $ 1.608 118 24 100 1,906 $ 1.247 $ $ $ $ S 106 1.906 $ CORPORATE $ =s = (11) (11) $ =$ = (11) (11) S CORPORATE = S = (7) (7) S = $ (7) (7) $ TOTAL NIKE, INC. 24,947 11,042 1,305 100 37,403 24,310 12,984 109 37,403 TOTAL NIKE, INC. 25,850 11,668 1,428 141 39,117 28,670 12,306 141 39,117 For the fiscal years anded May 31, 2020 and 2019, Other revenues for Global Brand Divisions and Converse ware primarily attributable to icensing businesses. For the fiscal years ended May 31, 2020 and 2019, Other revenues for Corporate primary consisted of foreign cumancy hedge gains and losses related to revenues generated by entities within the NIKE Brand geographic operating segments and Converse but managed through the Company's centrs foreign exchange risk management program. As of May 31, 2020 and 2018, the Company did not have any contract assets and had an immaterial amount of contract liabilities recorded in Accrued Lisbines on the Consolidated Balance Sheets. ↑ SALES-RELATED RESERVES At May 31, 2020 and May 31, 2019, the Company's sales-related reserve balance, which includes returns, post-invoice sales discounts and miscellaneous claims, was $1,178 million and $1,218 million, respectively, recorded in Accrued liabilities on the Consolidated Balance Sheets. The estimated cost of inventory for expected product returns was $313 million and $410 million as of May 31, 2020 and May 31, 2019, respectively, and was recorded in Prepaid expenses and other current assets on the Consolidated Balance Sheets. MAJOR CUSTOMERS No customer accounted for 10% or more of the Company's consolidated net Revenues during the fiscal years ended May 31, 2020, 2019 and 2018. ▶I NOTE 17 OPERATING SEGMENTS AND RELATED INFORMATION The Company's operating segments are evidence of the structure of the Company's internal organization. The NIKE Brand segments are defined by geographic regions for operations participating in NIKE Brand sales activity. Each NIKE Brand geographic segment operates predominantly in one industry: the design, development, marketing and selling of athletic footwear, apparel and equipment. The Company's reportable operating segments for the NIKE Brand are: North America; Europe, Middle East & Africa (EMEA); Greater China; and Asia Pacific & Latin America (APLA), and include results for the NIKE and Jordan brands, with the results for the Hurley brand, prior to its divestiture, included in North America. Refer to Note 20- Acquisitions and Divestitures for information regarding the divestiture of the Company's wholly-owned subsidiary, Hurley, and the planned transition of NIKE Brand businesses in certain countries within APLA to third-party distributors. The Company's NIKE Direct operations are managed within each NIKE Brand geographic operating segment. Converse is also a reportable segment for the Company, and operates in one industry: the design, marketing, licensing and selling of athletic lifestyle sneakers, apparel and accessories. Global Brand Divisions is included within the NIKE Brand for presentation purposes to align with the way management views the Company. Global Brand Divisions primarily represent NIKE Brand licensing businesses that are not part of a geographic operating segment, and demand creation and operating overhead expense, including product creation and design expenses that are centrally managed for the NIKE Brand, as well as costs associated with NIKE Direct global digital operations and enterprise technology. Corporate consists primarily of unallocated general and administrative expenses, including expenses associated with centrally managed departments; depreciation and amortization related to the Company's headquarters; unallocated insurance, benefit and compensation programs, including stock-based compensation; and certain foreign currency gains and losses, including certain hedge gains and losses. For the fiscal year ended May 31, 2020, Corporate includes the non-recurring impairment charge, recognized as a result of the Company's decision to transition its operations in Brazil, Argentina, Chile and Uruguay to third-party distributors. This charge primarily reflects the anticipated release of associated non-cash cumulative foreign currency translation losses. For more information regarding this charge, refer to Note 20-Acquisitions and Divestitures. The primary financial measure used by the Company to evaluate performance of individual operating segments is earnings before interest and taxes (EBIT), which represents Net income before Interest expense (income), net and Income tax expense in the Consolidated Statements of Income. As part of the Company's centrally managed foreign exchange risk management program, standard foreign currency rates are assigned twice per year to each NIKE Brand entity in the Company's geographic operating segments and to Converse. These rates are set approximately nine and twelve months in advance of the future selling seasons to which they relate (specifically, for each currency, one standard rate applies to the fall and holiday selling seasons and one standard rate applies to the spring and summer selling seasons) based on average market spot rates in the calendar month preceding the date they are established. Inventories and cost of sales for geographic operating segments and Converse reflect the use of these standard rates to record non-functional currency product purchases in the entity's functional currency. Differences between assigned standard foreign currency rates and actual market rates are included in Corporate, together with foreign currency hedge gains and losses generated from the Company's centrally managed foreign exchange risk management program and other conversion gains and losses. Accounts receivable, net, Inventories and Property, plant and equipment, net for operating segments are regularly reviewed by management and are therefore provided below. Da REVENUES North America Europe, Middle East & Africe Greater Chine Asia Pacific & Latin America Global Brand Division Total NIKE Brand Converse Corporate TOTAL NIKE, INC. REVENUES EARNINGS BEFORE INTEREST AND TAXES North America Europe, Middle East & Africa Greater China Asia Pacific & Latin America Global Brand Divisions Cover Corporate interest expenes (incomel, net TOTAL NIKE, INC. INCOME BEFORE INCOME TAXES ADDITIONS TO PROPERTY. PLANT AND EQUIPMENT North America Lurope, Middle East & Africa Greater China As a Pacho & Latin America Global Brand Divisions Total NIKE Drand Convers Corporate TOTAL ADDITIONS TO PROPERTY, PLANT AND EQUIPMENT DEPRECIATION North America Europe, Middle East & Africa Greater Ching Asia Pacific & Latin Americs Global Brand Divisions Total NIKE Brand Converse Corporate TOTAL DEPRECIATION S $ $ S S S S $ 2020 14,454 S 9,347 6,679 5.028 30 35,568 1,940 (11) 37,403 $ 2,899 S $ 1.541 2,490 1.164 (3,468) 297 (1,967) 89 2,887 $ 110 1 S 139 28 41 438 756 12 350 1,124 S 145 $ 132 44 46 214 584 25 112 721 S $ 2019 2637-63*= $359§¤€*; EN••**³8§ 2=****-:* 15.902 $ 37.218 39,117 $ (3.262) (1.810) $ $ S $ 149 S $ 706 $ 2018 છે - ક ર લ ત ાઇFe||Yકા બાર ક ક કા કામનું | (Dollars in millions) ACCOUNTS RECEIVABLE, NET North America Europe, Middle East & Africa Greater China Asia Pacific & Latin America(1) Global Brand Divisions Total NIKE Brand Converse Corporate TOTAL ACCOUNTS RECEIVABLE, NET INVENTORIES North America Europe, Middle East & Africa Greater China Asia Pacific & Latin America(1) Global Brand Divisions Total NIKE Brand Converse Corporate TOTAL INVENTORIES PROPERTY, PLANT AND EQUIPMENT, NET North America Europe, Middle East & Africa Greater China Asia Pacific & Latin America(1) Global Brand Divisions Total NIKE Brand Converse Corporate TOTAL PROPERTY, PLANT AND EQUIPMENT, NET $ $ $ $ $ $ 2020 AS OF MAY 31, 1,020 712 321 425 65 2,543 149 57 2,749 3,077 2,070 882 770 137 6,936 341 90 7,367 645 885 214 296 830 2,870 80 1,916 4,866 $ $ $ $ $ $ 2019 1,718 1,164 245 771 105 4,003 243 26 4,272 2,328 1,390 693 694 126 5,231 269 122 5,622 814 929 237 326 665 2,971 100 1,673 4,744 NOTE 19 - LEASES - Lease expense is recognized in Cost of sales or Operating overhead expense within the Consolidated Statements of Income, based on the underlying nature of the leased asset. For the fiscal year ended May 31, 2020, lease expense primarily consisted of operating lease costs of $569 million, along with $337 million primarily related to variable lease costs which includes an immaterial amount of short-term lease costs. As of and for the fiscal year ended May 31, 2020, finance leases were not a material component of the Company's lease portfolio. Amounts of future undiscounted cash flows related to operating lease payments over the lease term are as follows and are reconciled to the present value of the operating lease liabilities as recorded on the Consolidated Balance Sheets: (Dollars in millions) Fiscal 2021 Fiscal 2022 Fiscal 2023 Fiscal 2024 Fiscal 2025 Thereafter Total undiscounted future cash flows related to lease payments Less: Interest Present value of lease liabilities (Dollars in millions) Fiscal 2020 Fiscal 2021 Fiscal 2022 Fiscal 2023 Fiscal 2024 Thereafter TOTAL eing obligations include aloted to build to quit (1) Excludes $67 million of future operating lease payments for lease agreements signed but not yet commenced. In accordance with Topic 840, rent expense, excluding executory costs, was $829 million and $820 million for the fiscal years ended May 31, 2019 and 2018, respectively. ||Amounts of minimum future annual commitments under non-cancelable operating and capital leases in accordance with Topic 840 were as follows:|| AS OF MAY 31, 2019 CAPITAL LEASES AND OTHER FINANCING OBLIGATIONS(1) $ $ OPERATING LEASES 553 $ 513 441 386 345 $ 1,494 3,732 $ $ $ 32 34 40 37 34 197 374 $ AS OF MAY 31, 2020(1) $ TOTAL 550 514 456 416 374 1,474 3,784 426 3,358 585 547 481 423 379 1,691 4,106 The following table includes the weighted average remaining lease terms, in years, and the weighted average discount rate used to calculate the present value of operating lease liabilities: Weighted-average remaining lease term (years) Weighted-average discount rate -| The following table includes supplemental cash and non-cash information related to operating leases: (Dollars in millions) Cash paid for amounts included in the measurement of lease liabilities: Operating cash flows from operating leases Operating lease right-of-use assets obtained in exchange for new operating lease liabilities (1) (1) Excludes the amount initially capitalized in conjunction with the adoption of Topic 842. $ $ AS OF MAY 31, 2020 FISCAL YEAR ENDED MAY 31, 2020 8.7 2.4% 532 705 | SCHEDULE II - VALUATION AND QUALIFYING ACCOUNTS (Dollars in millions) Sales returns reserve (1) | (2) For the fiscal year ended May 31, 2018 For the fiscal year ended May 31, 2019(2) For the fiscal year ended May 31, 2020 Amounts included in this column primarily relate to foreign currency translation. $ 2020 FORM 10-K 100 BALANCE AT BEGINNING OF PERIOD 343 734 843 $ CHARGED TO COSTS AND EXPENSES 640 $ 1,959 1,941 As a result of the adoption of ASC Topic 606 during the first quarter of fiscal 2019, an asset for the estimated cost of inventory for expected products returns is now recognized separately from the liability for sales returns reserves, which is presented above. CHARGED TO OTHER ACCOUNTS(1) 5 (30) (31) $ WRITE-OFFS, NET (658) $ (1,820) (2,071) BALANCE AT END OF PERIOD 330 843 682 NIKE's Class B Common Stock is listed on the New York Stock Exchange and trades under the symbol NKE. At July 17, 2020, there were 23,114 holders of record of NIKE's Class B Common Stock and 14 holders of record of NIKE's Class A Common Stock. These figures do not include beneficial owners who hold shares in nominee name. The Class A Common Stock is not publicly traded, but each share is convertible upon request of the holder into one share of Class B Common Stock. Refer to Selected Quarterly Financial Data in Part II, Item 6 of this Report for dividends declared on the Class A and Class B Common Stock. In June 2018, the Board of Directors approved a four-year, $15 billion share repurchase program. As of May 31, 2020, the Company had repurchased 45.2 million shares at an average price of $89.00 per share for a total approximate cost of $4.0 billion under this program. All share repurchases were made under NIKE's publicly announced program and there are no other programs under which the Company repurchases shares. The following table presents a summary of share repurchases made during the quarter ended May 31, 2020: PERIOD March 1 - March 31, 2020 April 1- April 30, 2020 May 1 - May 31, 2020 TOTAL NUMBER OF SHARES PURCHASED 1,872,265 $ 1,872,265 $ AVERAGE PRICE PAID PER SHARE 85.08 $ $ 85.08 APPROXIMATE DOLLAR VALUE OF SHARES THAT MAY YET BE PURCHASED UNDER THE PLANS OR PROGRAMS (IN MILLIONS) 10,981 10,981 10,981 NIKE, INC. CONSOLIDATED STATEMENTS OF INCOME (In millions, except per share data) Revenues Cost of sales Gross profit Demand creation expense Operating overhead expense Total selling and administrative expense Interest expense (income), net Other (income) expense, net Income before income taxes Income tax expense NET INCOME Earnings per common share: Basic Diluted Weighted average common shares outstanding: Basic Diluted The accompanying Notes to the Consolidated Financial Statements are an integral part of this statement. 2020 FORM 10-K 56 $ $ $ $ 2020 37,403 $ 21,162 16,241 3,592 9,534 13,126 89 139 2,887 348 2,539 1.63 1.60 1,558.8 1,591.6 $ $ $ YEAR ENDED MAY 31, 2019 39,117 21,643 17,474 3,753 8,949 12,702 49 (78) 4,801 772 4,029 2.55 2.49 1,579.7 1,618.4 $ $ $ $ 2018 36,397 20,441 15,956 3,577 7,934 11,511 54 66 4,325 2,392 1,933 1.19 1.17 1,623.8 1,659.1
Expert Answer:
Answer rating: 100% (QA)
NIKE Inc was incorporated in 1967 under the laws of the State of Oregon As used in this report the terms we us NIKE and the Company refer to NIKE Inc and its predecessors subsidiaries and affiliates c... View the full answer

Related Book For 

Posted Date:
Students also viewed these general management questions
-
The following excerpt is from Coca-Cola Companys 2017 annual report filed with the SEC: Management evaluates the performance of our operating segments separately to individually monitor the different...
-
Answer these questions and show your work: 1. Assume that the company that you selected for the Module 1 SLP has a bond outstanding that matures in 20 years and has a coupon rate of 6.5%. The par...
-
A public companys annual report filed with the SEC includes a. A description of the business. b. Financial statements. c. Managements explanations for trends in sales. d. All of the above are...
-
Download a copy of the ACFE Compensation Guide for Anti-fraud Professionals, which is available at no charge at: www.acfe.com/documents/2008-comp-guide.pdf. Based on this resource, answer the...
-
The graph of the derivative f' of a continuous function f is shown. (a) On what intervals is f increasing? Decreasing? (b) At what values of x does f have a local maximum? Local minimum? (c) On what...
-
Giant acquired all of Small's common stock on January 1, 2011. Over the next few years, Giant applied the equity method to the recording of this investment. At the date of the original acquisition,...
-
This is actually a paired data situation (since each person was measured before and after eating organic), so we create a new variable, the differences in pesticide concentration, by taking pesticide...
-
Why do firms have separate departments for warehousing and shipping? What about warehousing and inventory control? Doesnt this just create more paperwork?
-
The density of a fluid changes with depth from the surface h according to the following formula: (h) = ch 2 , where c is a constant. A. What an expression for the gauge pressure p as a function of...
-
Harrison Printing has projected its sales for the first eight months of 2014 as follows: Harrison collects 20 percent of its sales in the month of the sale, 50 percent in the month following the...
-
If the power spectral density (PSD) of the input voltage x(t) is Sx (f) = 10A (16), find the power of the output voltage y(t).
-
Refer to Table 2.2, in which annual macroeconomic data including GDP, CPI, 3-month T-bill rate, prime rate, private consumption, private investment, net exports, and government expenditures from 1960...
-
The Madagascar Corporation wants to achieve a steady 9 percent growth rate. If it can achieve a 13 percent return on equity, what percentage of earnings must Madagascar retain for investment purposes?
-
The market price for the Fidesco Groups common stock is \($64\) per share. The price at the end of year 1 is expected to be \($75,\) and dividends for next year should be \($3.98.\) What is the...
-
How does a bonds intrinsic value differ from its market value? Under what circumstance might they be equal?
-
Danang Rubber Co.s bonds are selling in the market for \($1,060.\) These 13-year bonds pay 9 percent interest annually on a \($1,000\) par value. If they are purchased at the market price, what is...
-
Cairns owns 80 percent of the voting stock of Hamilton, Inc. The parents interest was acquired several years ago on the date that the subsidiary was formed. Consequently, no goodwill or other...
-
Outline some of the major problems confronting an international advertiser.
-
Systematic treatment of equilibrium. The acidity of Al3+ is determined by the following reactions. Write the equations needed to find the pH of Al(ClO4)3 at a formal concentration F. 2 + 2H20-Al(...
-
Consider the diprotic acid H2A with K1 = 1.00 10-4 and K2 = 1.00 10-8. Find the pH and concentrations of H2A, HA-, and A2- in (a) 0.100 M H2A; (b) 0.100 M NaHA; (c) 0.100 M Na2A.
-
Use the method in Box 9-2 to find the pH and concentration of HA- in a 0.01 F solution of the amphiprotic salt Na+ HA- derived from the diprotic acid H2A with pK1 = 4 and (a) pK2 = 8 or (b) pK2 = 5.
-
The primary problem with the hypothesis that life on Earth originated on Mars is that (a) Mars has never had water. (b) the proposed Martian fossils are much smaller than the tiniest bacteria on...
-
Which of these statements regarding the origin of life is false? (a) Life originated on an Earth whose atmosphere contained high levels of oxygen. (b)Miller and Urey obtained amino acids and other...
-
Which of the following mechanisms of evolution consistently causes populations to become more adapted to their environments? (a) natural selection (b)mutation pressure (c) genetic drift (d) gene flow

Study smarter with the SolutionInn App