

Question: Can someone please convert this data into a bar chart? With Sales and Net Income Forecast for years 2019-2021 Home Insert Draw Page Layout Fo
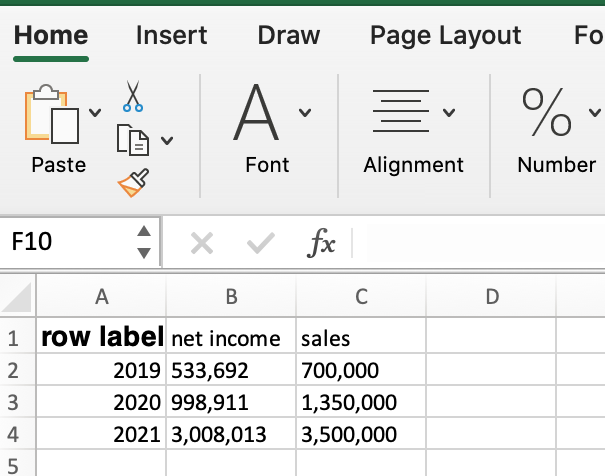
Can someone please convert this data into a bar chart? With Sales and Net Income Forecast for years 2019-2021
Home Insert Draw Page Layout Fo & Au % Paste Font Alignment Number F10 f . B D 2. 3 1 row label net income sales 2 2019 533,692 700,000 3 2020 998,911 1,350,000 4 2021 3,008,013 3,500,000 5
Step by Step Solution
There are 3 Steps involved in it
1 Expert Approved Answer
Step: 1 Unlock

Question Has Been Solved by an Expert!
Get step-by-step solutions from verified subject matter experts
Step: 2 Unlock
Step: 3 Unlock