

Question: Can someone please explain and interpret the logistic regression outcome that has been done in this excel. Training: Classification Summary Confusion Matrix ActualPredicted * 0
Can someone please explain and interpret the logistic regression outcome that has been done in this excel.
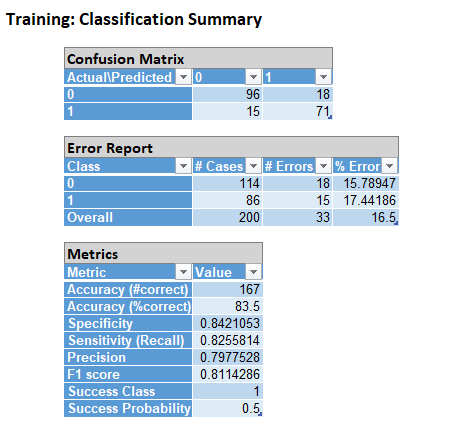
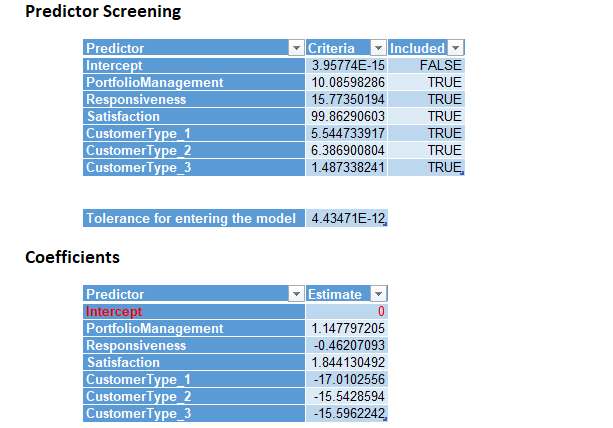
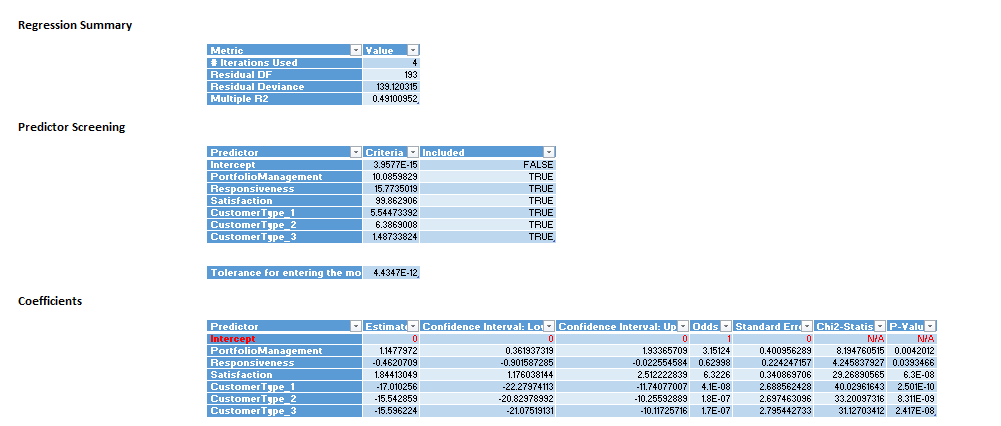
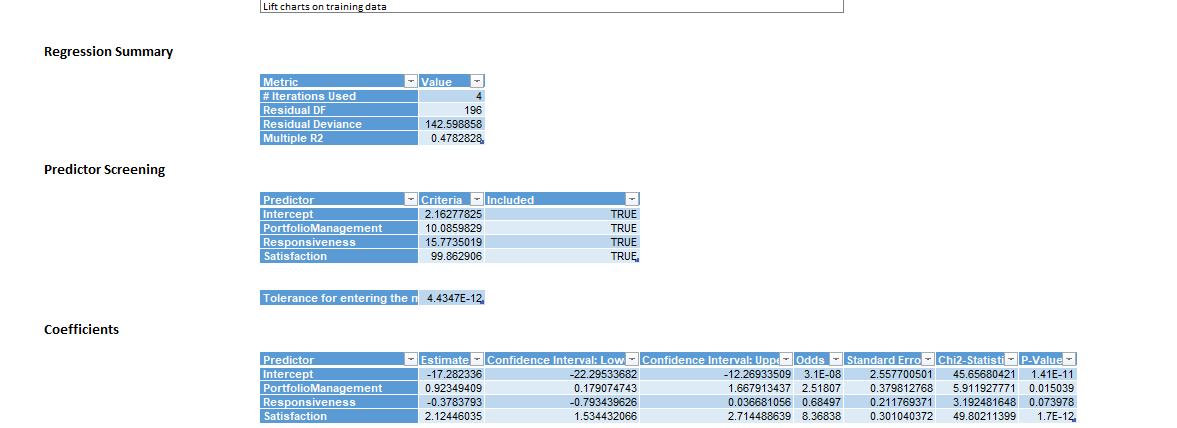
Training: Classification Summary Confusion Matrix Actual\\Predicted * 0 1 0 96 18 15 71, Error Report Class # Cases * # Errors * % Error 0 114 18 15.78947 86 15 17.44186 Overall 200 33 16.5 Metrics Metric Value Accuracy (#correct) 167 Accuracy (%correct) 83.5 Specificity 0.8421053 Sensitivity (Recall) 0.8255814 Precision 0.7977528 F1 score 0.8114286 Success Class Success Probability 0.5Predictor Screening Predictor Criteria Included Intercept 3.95774E-15 FALSE PortfolioManagement 10.08598286 TRUE Responsiveness 15.77350194 TRUE Satisfaction 99.86290603 TRUE CustomerType 1 5.544733917 TRUE CustomerType 2 6.386900804 TRUE CustomerType_3 1.487338241 TRUE Tolerance for entering the model 4.43471E-12 Coefficients Predictor Estimate Intercept 0 PortfolioManagement 1. 147797205 Responsiveness -0.46207093 Satisfaction 1.844130492 CustomerType_1 -17.0102556 CustomerType 2 -15.5428594 CustomerType_3 -15.5962242Regression Summary Metric Value # Iterations Used 4 Residual DF 193 Residual Deviance 139.120315 Multiple R2 0.49100952 Predictor Screening Predictor Criteria = Included Intercept 3.9577E-15 FALSE PortfolioManagement 10.0859829 TRUE Responsiveness 15.7735019 TRUE Satisfaction 99.862906 TRUE Customer Type 1 5.54473392 TRUE Customer Type 2 6.3869008 TRUE Customer Type_3 1.48733824 TRUE Tolerance for entering the mo 4.4347E-12 Coefficients Predictor Estimate= Confidence Interval: Lon. |Confidence Interval: Up - Odds - Standard Err Chi2-Statis - P-Valu =] Intercept 0 NIA NIA PortfolioManagement 1.1477972 0.361937319 1.93365709 3.15124 0.400956289 8.194760515 0.0042012 Responsiveness 0.4620709 -0.901587285 0.022554584 0.62998 0.224247157 4.245837927 0.0393466 Satisfaction 1.84413049 1.176038144 2.512222839 6.3226 0.340869706 29.26890565 6.3E-08 CustomerType 1 -17.010256 22.27974113 11.74077007 4.1E-08 2.688562428 40.02961643 2.5018-10 Customer Type 2 -15.542859 -20.82978992 -10.25592889 1.8E-07 2.697463096 33.20097316 8.3118-09 Customer Type_3 15.596224 -21.07519131 -10.11725716 1.7E-07 2.795442733 31.12703412 2.417E-08,Lift charts on training data Regression Summary Metric - Value # Iterations Used Residual DF 196 Residual Deviance 142.598858 Multiple R2 0.4782828 Predictor Screening Predictor - Criteria ~ Included Intercept 2.16277825 TRUE PortfolioManagement 10.0859829 TRUE Responsiveness 15.7735019 TRUE Satisfaction 99.862906 TRUE Tolerance for entering the n 4.4347E-12 Coefficients Predictor Estimate ~|Confidence Interval: Low~|Confidence Interval: Upper |Odds ~|Standard Erro ~|Chi2-Statisti ~|P-Value - Intercept -17.282336 -22.29533682 12.26933509 3.16-08 2.557700501 45.65680421 1.418-11 PortfolioManagement 0.92349409 0.179074743 1.667913437 2.51807 0.379812768 5.911927771 0.015039 Responsiveness -0.3783793 -0.793439626 0.036681056 0.68497 0.211769371 3.192481648 0.073978 Satisfaction 2. 12446035 1.534432066 2.714488639 8.36838 0.301040372 49.80211399 1.7E-12
Step by Step Solution
There are 3 Steps involved in it

Get step-by-step solutions from verified subject matter experts