

Question: can someone please explain how to construct the graphs and answer the questions properly. i beg. it's biostatistics. Data set for a zoologist growing fish
can someone please explain how to construct the graphs and answer the questions properly. i beg. it's biostatistics. 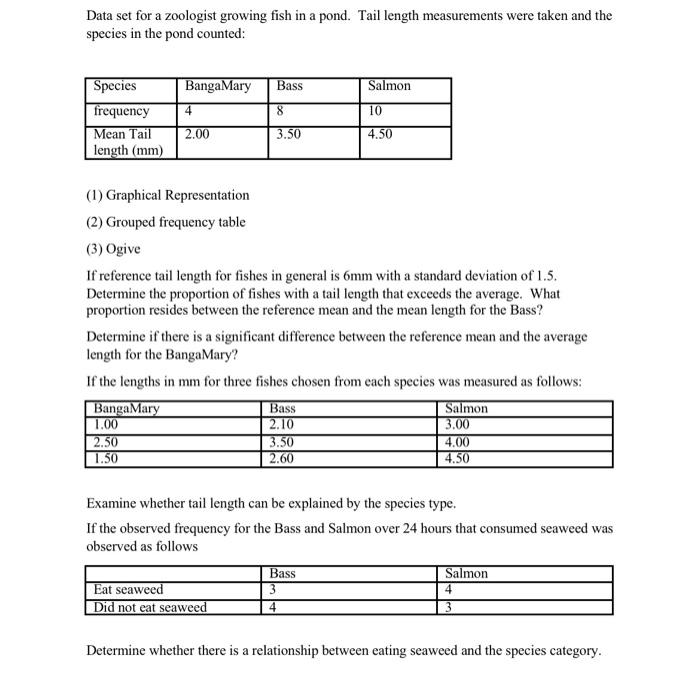
Data set for a zoologist growing fish in a pond. Tail length measurements were taken and the species in the pond counted: Bass Salmon BangaMary 4 2.00 8 Species frequency Mean Tail length (mm) 10 3.50 4.50 (1) Graphical Representation (2) Grouped frequency table (3) Ogive If reference tail length for fishes in general is 6mm with a standard deviation of 1.5. Determine the proportion of fishes with a tail length that exceeds the average. What proportion resides between the reference mean and the mean length for the Bass? Determine if there is a significant difference between the reference mean and the average length for the BangaMary? If the lengths in mm for three fishes chosen from each species was measured as follows: BangaMary Bass Salmon 1.00 2.10 3.00 2.50 3.50 4.00 1.50 2.60 4.50 Examine whether tail length can be explained by the species type. If the observed frequency for the Bass and Salmon over 24 hours that consumed seaweed was observed as follows Bass 3 4 Salmon 4 Eat seaweed Did not eat seaweed 3 Determine whether there is a relationship between eating seaweed and the species category. Data set for a zoologist growing fish in a pond. Tail length measurements were taken and the species in the pond counted: Bass Salmon BangaMary 4 2.00 8 Species frequency Mean Tail length (mm) 10 3.50 4.50 (1) Graphical Representation (2) Grouped frequency table (3) Ogive If reference tail length for fishes in general is 6mm with a standard deviation of 1.5. Determine the proportion of fishes with a tail length that exceeds the average. What proportion resides between the reference mean and the mean length for the Bass? Determine if there is a significant difference between the reference mean and the average length for the BangaMary? If the lengths in mm for three fishes chosen from each species was measured as follows: BangaMary Bass Salmon 1.00 2.10 3.00 2.50 3.50 4.00 1.50 2.60 4.50 Examine whether tail length can be explained by the species type. If the observed frequency for the Bass and Salmon over 24 hours that consumed seaweed was observed as follows Bass 3 4 Salmon 4 Eat seaweed Did not eat seaweed 3 Determine whether there is a relationship between eating seaweed and the species category Step by Step Solution
There are 3 Steps involved in it
1 Expert Approved Answer
Step: 1 Unlock

Question Has Been Solved by an Expert!
Get step-by-step solutions from verified subject matter experts
Step: 2 Unlock
Step: 3 Unlock