

Question: Can someone please explain how to solve this problem? Thank you in advance. Conduct the hypothesis test and provide the test statistic and the critical
Can someone please explain how to solve this problem? Thank you in advance.
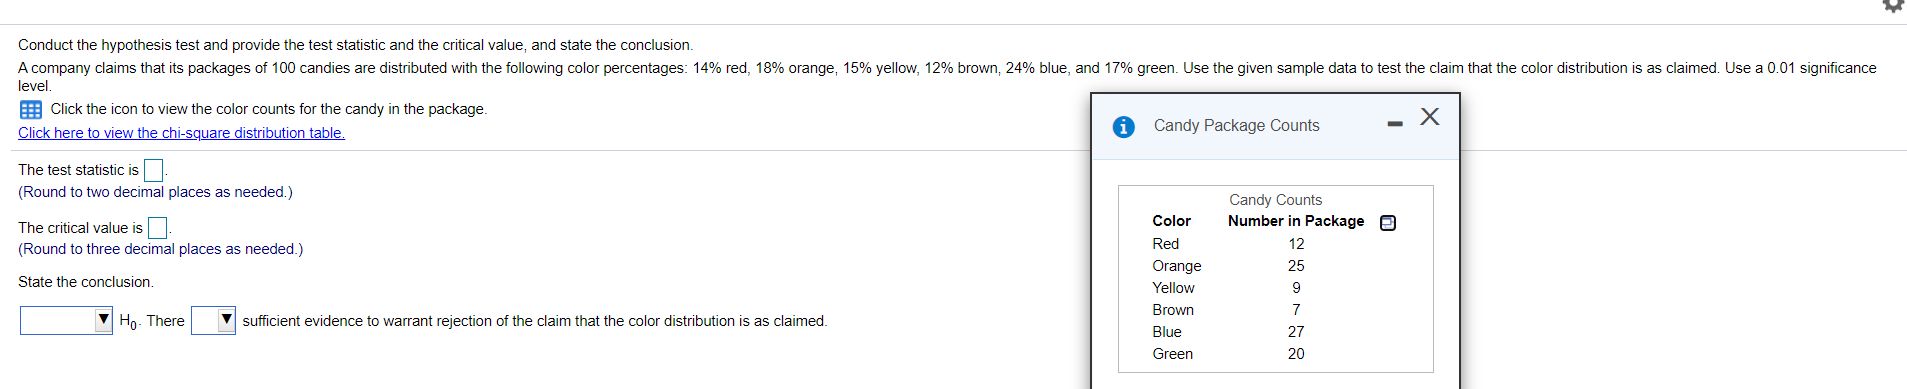
Conduct the hypothesis test and provide the test statistic and the critical value, and state the conclusion. A company claims that its packages of 100 candies are distributed with the following color percentages: 14% red, 18% orange, 15% yellow, 12% brown, 24% blue, and 17% green. Use the given sample data to test the claim that the color distribution is as claimed. Use a 0.01 significance level. Click the icon to view the color counts for the candy in the package. Candy Package Counts - X Click here to view the chi-square distribution table. The test statistic is. Candy Counts (Round to two decimal places as needed.) Color Number in Package O The critical value is]. Red 12 (Round to three decimal places as needed.) Orange 25 Yellow 9 State the conclusion. Brown 7 Ho. There sufficient evidence to warrant rejection of the claim that the color distribution is as claimed. Blue 27 Green 20
Step by Step Solution
There are 3 Steps involved in it

Get step-by-step solutions from verified subject matter experts