

Question: Can someone please explain this question please?' Use the information shown in the graph. The graph represents a survey of undergraduates enrolled in college in
Can someone please explain this question please?'
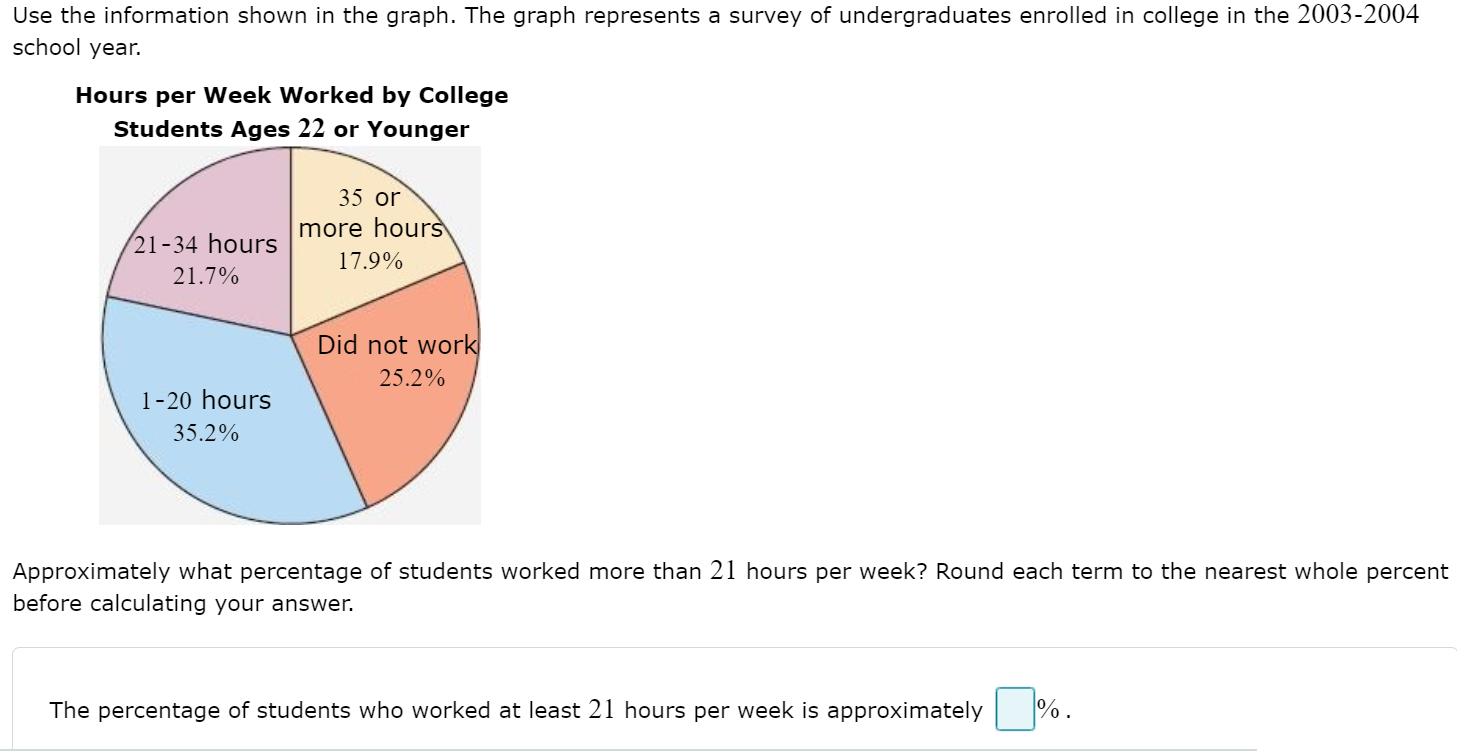
Use the information shown in the graph. The graph represents a survey of undergraduates enrolled in college in the 2003-2004 school year. Hours per Week Worked by College Students Ages 22 or Younger Approximately what percentage of students worked more than 21 hours per week? Round each term to the nearest whole percent before calculating your answer. The percentage of students who worked at least 21 hours per week is approximately [:]%
Step by Step Solution
There are 3 Steps involved in it
1 Expert Approved Answer
Step: 1 Unlock

Question Has Been Solved by an Expert!
Get step-by-step solutions from verified subject matter experts
Step: 2 Unlock
Step: 3 Unlock