

Question: Can someone please go step by step how to create the visualizations on excel? Please be as descriptive as possible because my graphics have come
Can someone please go step by step how to create the visualizations on excel? Please be as descriptive as possible because my graphics have come out crazy.
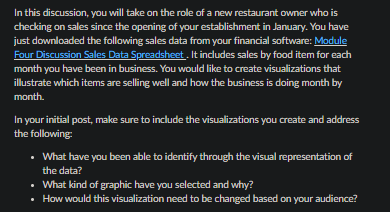
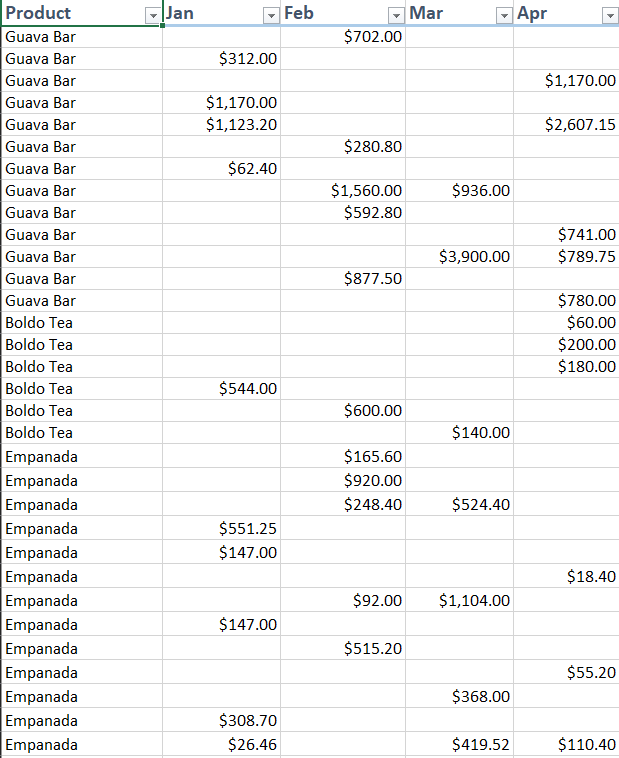
In this discussion, you will take on the role of a new restaurant owner who is checking on sales since the opening of your establishment in January. You have just downloaded the following sales data from your financial software: Module Four Discussion Sales Data Spreadsheet. It includes sales by food item for each month you have been in business. You would like to create visualizations that illustrate which items are selling well and how the business is doing month by month. In your initial post, make sure to include the visualizations you create and address the following: - What have you been able to identify through the visual representation of the data? - What kind of graphic have you selected and why? - How would this visualization need to be changed based on your audience? In this discussion, you will take on the role of a new restaurant owner who is checking on sales since the opening of your establishment in January. You have just downloaded the following sales data from your financial software: Module Four Discussion Sales Data Spreadsheet. It includes sales by food item for each month you have been in business. You would like to create visualizations that illustrate which items are selling well and how the business is doing month by month. In your initial post, make sure to include the visualizations you create and address the following: - What have you been able to identify through the visual representation of the data? - What kind of graphic have you selected and why? - How would this visualization need to be changed based on your audience
Step by Step Solution
There are 3 Steps involved in it

Get step-by-step solutions from verified subject matter experts