

Question: can someone please graph the function and tell me the key features that are in this picture ? 2. Complete a function analysis of the
can someone please graph the function and tell me the key features that are in this picture ?
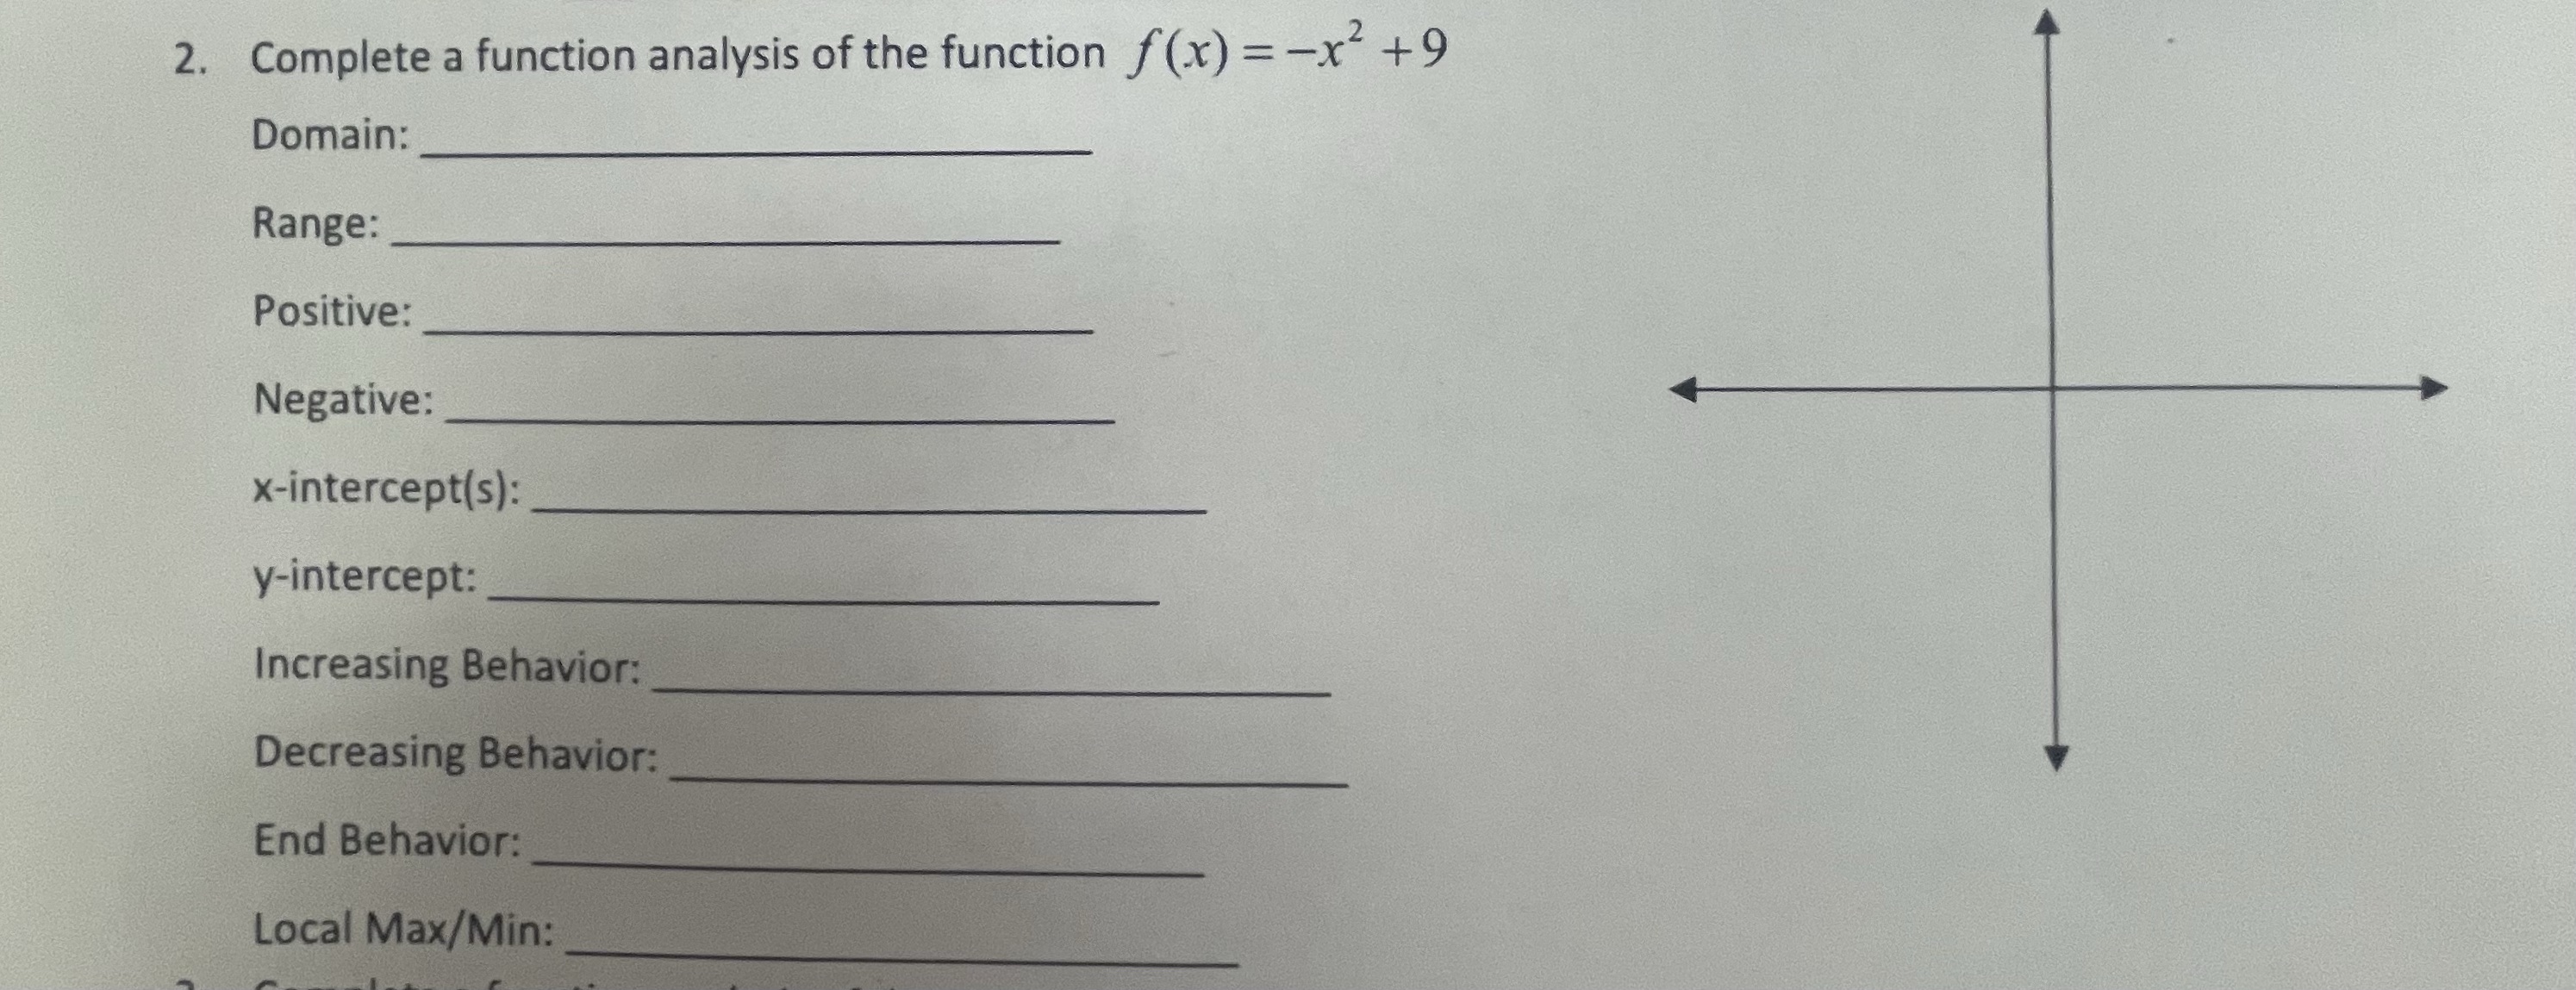
2. Complete a function analysis of the function f(x) =-x2 +9 Domain: Range: Positive: Negative: x-intercept(s): y-intercept: Increasing Behavior: Decreasing Behavior: End Behavior: Local Max/Min
Step by Step Solution
There are 3 Steps involved in it
1 Expert Approved Answer
Step: 1 Unlock

Question Has Been Solved by an Expert!
Get step-by-step solutions from verified subject matter experts
Step: 2 Unlock
Step: 3 Unlock