

Question: can someone please help me answer this Problem Analysis (100 points) 1) Service Quality - P chart (20 points) Several complaints recently have been sent
can someone please help me answer this 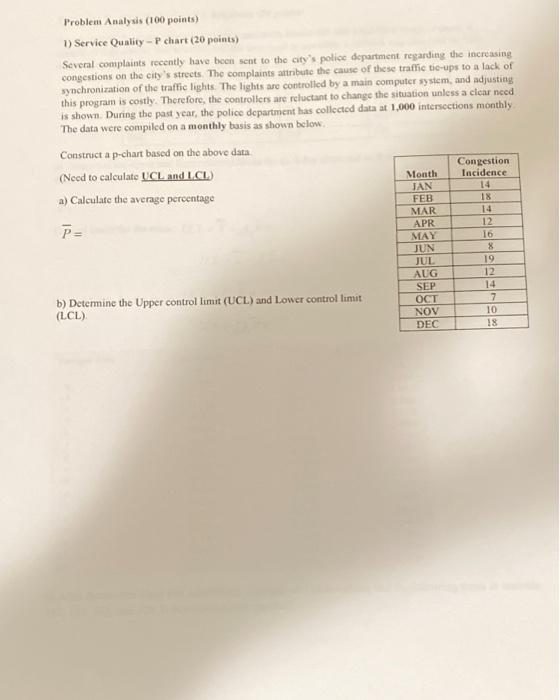
Problem Analysis (100 points) 1) Service Quality - P chart (20 points) Several complaints recently have been sent to the city's police department regarding the increasing congestions on the city's streets. The complaints attribute the cause of these traffic tie-ups to a lack of synchronization of the traffic lights. The lights are controlled by a main computer system, and adjusting this program is costly. Therefore, the controllers are reluctant to change the situation unless a clear nced is shown. During the past year, the police department has collected data at 1,000 intersections monthly The data were compiled on a monthly basis as shown below Construct a p-chart based on the above data Congestion (Noed to calculate UCL and LCL Month Incidence a) Calculate the average percentage MAR P- APR MAY 16 JUN JUL 19 AUG SEP 14 b) Determine the Upper control limit (UCL) and Lower controllimit OCT (LCL) NOV DEC 18 JAN FEB 14 18 14 12 8 12 7 10
Step by Step Solution
There are 3 Steps involved in it
1 Expert Approved Answer
Step: 1 Unlock

Question Has Been Solved by an Expert!
Get step-by-step solutions from verified subject matter experts
Step: 2 Unlock
Step: 3 Unlock