

Question: can someone please help me answer this thoroughly? Design Layout References Mailings Review View Help dy) - A A Aa~ Po IST AaBbCcDC AaBbCcDc AaBbCc
can someone please help me answer this thoroughly?
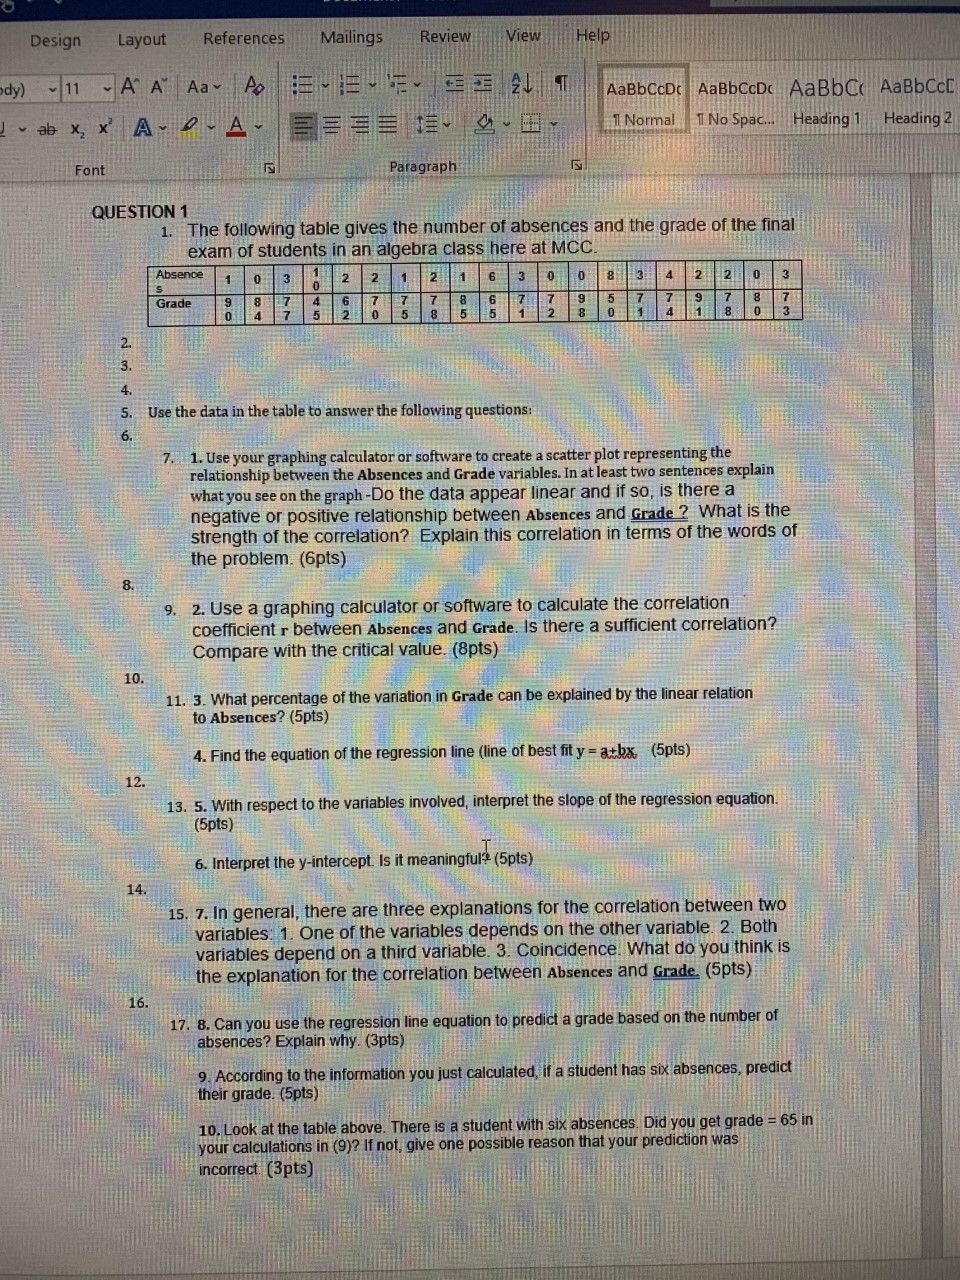
Design Layout References Mailings Review View Help dy) - A A Aa~ Po IST AaBbCcDC AaBbCcDc AaBbCc AaBbCcD "abx x A- - A 1 Normal 1 No Spac... Heading 1 Heading 2 Font Paragraph QUESTION 1 1. The following table gives the number of absences and the grade of the final exam of students in an algebra class here at MCC Absence 1 3 8 3 1 2 2 0 3 Grade Use the data in the table to answer the following questions: 7. 1. Use your graphing calculator or software to create a scatter plot representing the relationship between the Absences and Grade variables. In at least two sentences explain what you see on the graph -Do the data appear linear and if so, is there a negative or positive relationship between Absences and Grade ? What is the strength of the correlation? Explain this correlation in terms of the words of the problem. (6pts) 8. 9. 2. Use a graphing calculator or software to calculate the correlation coefficient r between Absences and Grade. Is there a sufficient correlation? Compare with the critical value. (8pts) 10 11. 3. What percentage of the variation in Grade can be explained by the linear relation to Absences? (5pts) 4. Find the equation of the regression line (line of best fit y = atbx, (5pts) 12. 13. 5. With respect to the variables involved, interpret the slope of the regression equation. (5pts) 6. Interpret the y-intercept. Is it meaningful* (5pts) 14. 15. 7. In general, there are three explanations for the correlation between two variables: 1. One of the variables depends on the other variable. 2. Both variables depend on a third variable. 3. Coincidence. What do you think is the explanation for the correlation between Absences and Grade. (5pts) 16. 17. 8. Can you use the regression line equation to predict a grade based on the number of absences? Explain why. (3pts) 9. According to the information you just calculated, if a student has six absences, predict their grade. (5pts) 10. Look at the table above. There is a student with six absences. Did you get grade = 65 in your calculations in (9)? If not, give one possible reason that your prediction was incorrect. (3pts)
Step by Step Solution
There are 3 Steps involved in it

Get step-by-step solutions from verified subject matter experts