

Question: can someone please help me figure out the exact data I would need to pull from this information given by this company in order to
can someone please help me figure out the exact data I would need to pull from this information given by this company in order to be able to calculate in detail the: a) cost of equity - using both the dividend growth model and the CAPM b) calculate the expected rate of return and do a 1 year stock performance evaluation, c) cost of debt d) WACC
Thank you very kindly!
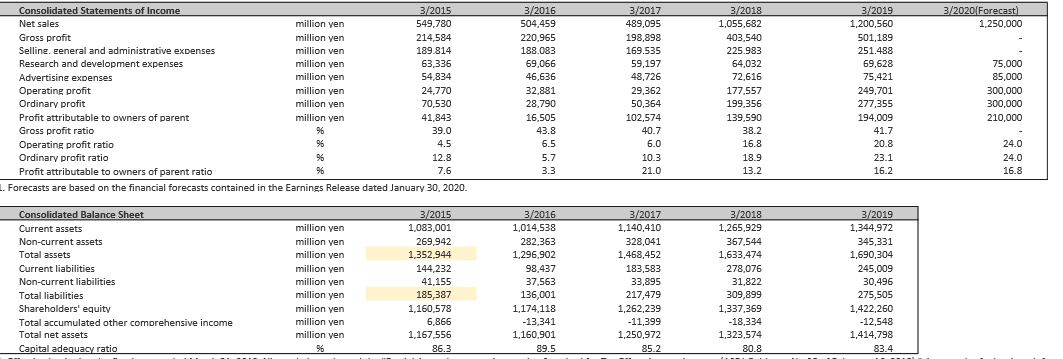
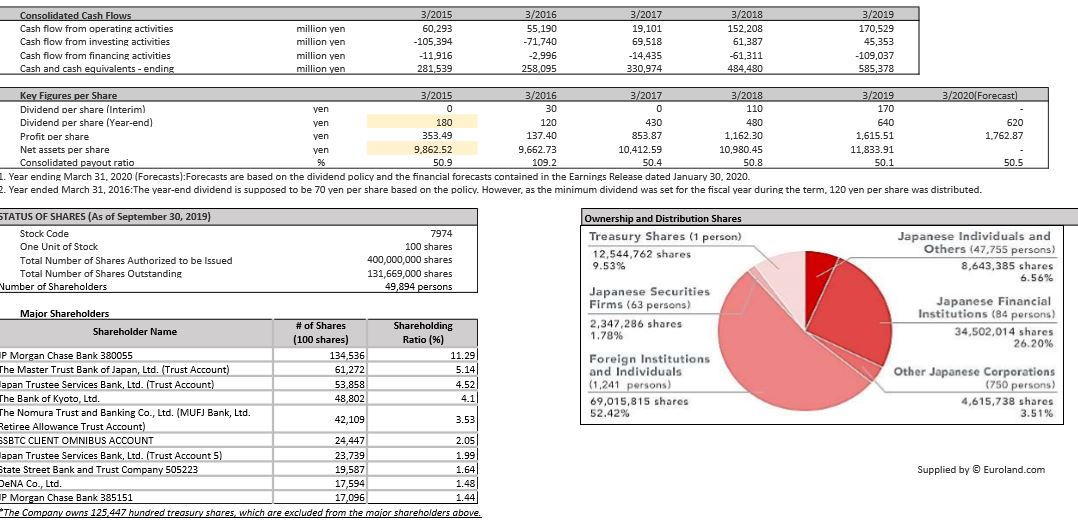
3/2020/Forecast) 1,250,000 Consolidated Statements of Income 3/2015 Net sales million yen 549,780 Gross profit million yen 214,584 Selline. Eeneral and administrative expenses million ven 189.814 Research and development expenses million yen 63,336 Advertising expenses million yen 54,834 Operating profit million yen 24,770 Ordinary profit million yen 70,530 Profit attributable to owners of parent million yen 41,843 Gross profit ratio 39.0 Operating profit ratio 4.5 Ordinary profit ratio 12.8 Profit attributable to owners of parent ratio 7.6 1. Forecasts are based on the financial forecasts contained in the Earnings Release dated January 30, 2020. 3/2016 504,459 220,965 188.083 69,066 46,636 32,881 28,790 16,505 43.8 6.5 3/2017 489,095 198,898 169.535 59,197 48,726 29,362 50,364 102,574 40.7 3/2018 1,055,682 403,540 225.983 64,032 72,616 177.557 199,356 189 590 38.2 16.8 18.9 13.2 3/2019 1,200,560 501,189 251.488 69,628 75,421 249,701 277,355 194,009 41.7 20.8 23.1 16.2 75,000 85,000 300,000 300,000 210,000 6.0 5.7 10.3 21.0 24.0 24.0 16.8 3.3 Consolidated Balance Sheet Current assets Non-current assets Total assets Current liabilities Non-current liabilities Total liabilities Shareholders' equity Total accumulated other comprehensive income Total net assets Capital adequacy ratio million yen million yen million yen million yen million yen million yen million yen million yen million yen 3/2015 1,083,001 269,942 1,352,944 144,232 41,155 185,387 1,160,578 6,866 1,167,556 86.3 3/2016 1,014.538 282.363 1,296,902 98,437 37.563 136,001 1,174,118 -13.341 1.160.901 89.5 3/2017 1,140,410 328,041 1,468,452 183,583 33,895 217,479 1,262,239 -11,399 1,250,972 85.2 3/2018 1,265,929 367,544 1,633,474 278,076 31,822 309,899 1,337,369 -18,334 1,323,574 80.8 3/2019 1,344,972 345,331 1,690,304 245,009 30,496 275,505 1,422,260 -12,548 1,414,798 83.4 Consolidated Cash Flows Cash flow from operating activities Cash flow from investing activities Cash flow from financing activities Cash and cash equivalents - ending million yen million yen million yen million yen 3/2015 60,293 -105,394 -11,916 281,539 3/2016 55.190 -71,740 -2.996 258,095 3/2017 19,101 69,518 -14,435 330,974 3/2018 152.208 61.387 -61.311 484,480 3/2019 170,529 45,353 -109,037 585,378 ven 30 110 620 Key Figures per Share 3/2015 3/2016 3/2017 3/2018 3/2019 3/2020 Forecast) Dividend per share (interim) 170 Dividend per share (Year-end) ven 180 120 430 480 640 Profit per share yen 353.49 137.40 853.87 1,162.30 1,615.51 1.762.87 Net assets per share yen 9,862.52 9,662.73 10,412.59 10,980.45 11,833.91 Consolidated payout ratio 50.9 109.2 50.4 50.8 50.1 50.5 1. Year ending March 31, 2020 (Forecasts):Forecasts are based on the dividend policy and the financial forecasts contained in the Earnings Release dated January 30, 2020. 2. Year ended March 31, 2016:The year-end dividend is supposed to be 70 yen per share based on the policy. However, as the minimum dividend was set for the fiscal year during the term. 120 yen per share was distributed. STATUS OF SHARES (As of September 30, 2019) Stock Code One Unit of Stock Total Number of Shares Authorized to be issued Total Number of Shares Outstanding Number of Shareholders 7974 100 shares 400,000,000 shares 131,669,000 shares 49,894 persons Ownership and Distribution Shares Treasury Shares (1 person) 12,544,762 shares 9.53% Japanese Individuals and Others (47.755 persons) 8,643,385 shares 6.56% Japanese Securities Firms (63 persons) 2,347,286 shares 1.78% Japanese Financial Institutions (84 persons) 34,502,014 shares 26.20% Major Shareholders # of Shares Shareholder Name Shareholding (100 shares) Ratio (%) P Morgan Chase Bank 380055 134,536 11.29 The Master Trust Bank of Japan, Ltd. (Trust Account) 61,272 5.14 apan Trustee Services Bank, Ltd. (Trust Account) 53.858 4.52 The Bank of Kyoto, Ltd. 48,802 The Nomura Trust and Banking Co., Ltd. (MUFJ Bank, Ltd. 42,109 3.53 Retiree Allowance Trust Account) SSBTC CLIENT OMNIBUS ACCOUNT 24,447 2.05 lapan Trustee Services Bank, Ltd. (Trust Account 5) 23,739 1.99 State Street Bank and Trust Company 505223 19,587 1.641 DeNA Co., Ltd. 17 594 1.48 P Morgan Chase Bank 385151 17,096 1.441 The Company owns 125,447 hundred treasury shares, which are excluded from the major shareholders above. Foreign Institutions and Individuals (1.241 persons) 69,015,815 shares 52.42% Other Japanese Corporations (750 persons) 4,615,738 shares 3.51% 4.1 Supplied by Euroland.com 3/2020/Forecast) 1,250,000 Consolidated Statements of Income 3/2015 Net sales million yen 549,780 Gross profit million yen 214,584 Selline. Eeneral and administrative expenses million ven 189.814 Research and development expenses million yen 63,336 Advertising expenses million yen 54,834 Operating profit million yen 24,770 Ordinary profit million yen 70,530 Profit attributable to owners of parent million yen 41,843 Gross profit ratio 39.0 Operating profit ratio 4.5 Ordinary profit ratio 12.8 Profit attributable to owners of parent ratio 7.6 1. Forecasts are based on the financial forecasts contained in the Earnings Release dated January 30, 2020. 3/2016 504,459 220,965 188.083 69,066 46,636 32,881 28,790 16,505 43.8 6.5 3/2017 489,095 198,898 169.535 59,197 48,726 29,362 50,364 102,574 40.7 3/2018 1,055,682 403,540 225.983 64,032 72,616 177.557 199,356 189 590 38.2 16.8 18.9 13.2 3/2019 1,200,560 501,189 251.488 69,628 75,421 249,701 277,355 194,009 41.7 20.8 23.1 16.2 75,000 85,000 300,000 300,000 210,000 6.0 5.7 10.3 21.0 24.0 24.0 16.8 3.3 Consolidated Balance Sheet Current assets Non-current assets Total assets Current liabilities Non-current liabilities Total liabilities Shareholders' equity Total accumulated other comprehensive income Total net assets Capital adequacy ratio million yen million yen million yen million yen million yen million yen million yen million yen million yen 3/2015 1,083,001 269,942 1,352,944 144,232 41,155 185,387 1,160,578 6,866 1,167,556 86.3 3/2016 1,014.538 282.363 1,296,902 98,437 37.563 136,001 1,174,118 -13.341 1.160.901 89.5 3/2017 1,140,410 328,041 1,468,452 183,583 33,895 217,479 1,262,239 -11,399 1,250,972 85.2 3/2018 1,265,929 367,544 1,633,474 278,076 31,822 309,899 1,337,369 -18,334 1,323,574 80.8 3/2019 1,344,972 345,331 1,690,304 245,009 30,496 275,505 1,422,260 -12,548 1,414,798 83.4 Consolidated Cash Flows Cash flow from operating activities Cash flow from investing activities Cash flow from financing activities Cash and cash equivalents - ending million yen million yen million yen million yen 3/2015 60,293 -105,394 -11,916 281,539 3/2016 55.190 -71,740 -2.996 258,095 3/2017 19,101 69,518 -14,435 330,974 3/2018 152.208 61.387 -61.311 484,480 3/2019 170,529 45,353 -109,037 585,378 ven 30 110 620 Key Figures per Share 3/2015 3/2016 3/2017 3/2018 3/2019 3/2020 Forecast) Dividend per share (interim) 170 Dividend per share (Year-end) ven 180 120 430 480 640 Profit per share yen 353.49 137.40 853.87 1,162.30 1,615.51 1.762.87 Net assets per share yen 9,862.52 9,662.73 10,412.59 10,980.45 11,833.91 Consolidated payout ratio 50.9 109.2 50.4 50.8 50.1 50.5 1. Year ending March 31, 2020 (Forecasts):Forecasts are based on the dividend policy and the financial forecasts contained in the Earnings Release dated January 30, 2020. 2. Year ended March 31, 2016:The year-end dividend is supposed to be 70 yen per share based on the policy. However, as the minimum dividend was set for the fiscal year during the term. 120 yen per share was distributed. STATUS OF SHARES (As of September 30, 2019) Stock Code One Unit of Stock Total Number of Shares Authorized to be issued Total Number of Shares Outstanding Number of Shareholders 7974 100 shares 400,000,000 shares 131,669,000 shares 49,894 persons Ownership and Distribution Shares Treasury Shares (1 person) 12,544,762 shares 9.53% Japanese Individuals and Others (47.755 persons) 8,643,385 shares 6.56% Japanese Securities Firms (63 persons) 2,347,286 shares 1.78% Japanese Financial Institutions (84 persons) 34,502,014 shares 26.20% Major Shareholders # of Shares Shareholder Name Shareholding (100 shares) Ratio (%) P Morgan Chase Bank 380055 134,536 11.29 The Master Trust Bank of Japan, Ltd. (Trust Account) 61,272 5.14 apan Trustee Services Bank, Ltd. (Trust Account) 53.858 4.52 The Bank of Kyoto, Ltd. 48,802 The Nomura Trust and Banking Co., Ltd. (MUFJ Bank, Ltd. 42,109 3.53 Retiree Allowance Trust Account) SSBTC CLIENT OMNIBUS ACCOUNT 24,447 2.05 lapan Trustee Services Bank, Ltd. (Trust Account 5) 23,739 1.99 State Street Bank and Trust Company 505223 19,587 1.641 DeNA Co., Ltd. 17 594 1.48 P Morgan Chase Bank 385151 17,096 1.441 The Company owns 125,447 hundred treasury shares, which are excluded from the major shareholders above. Foreign Institutions and Individuals (1.241 persons) 69,015,815 shares 52.42% Other Japanese Corporations (750 persons) 4,615,738 shares 3.51% 4.1 Supplied by Euroland.com
Step by Step Solution
There are 3 Steps involved in it

Get step-by-step solutions from verified subject matter experts