

Question: Can someone please help me solve this ASAP? I don't understand it. The following table contains figures on the monthly volume and unit costs for
Can someone please help me solve this ASAP? I don't understand it. 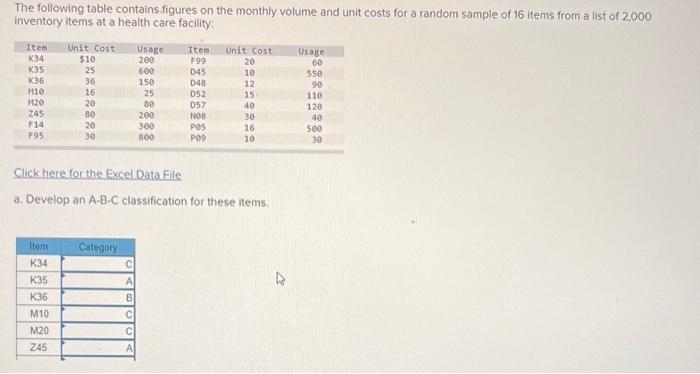
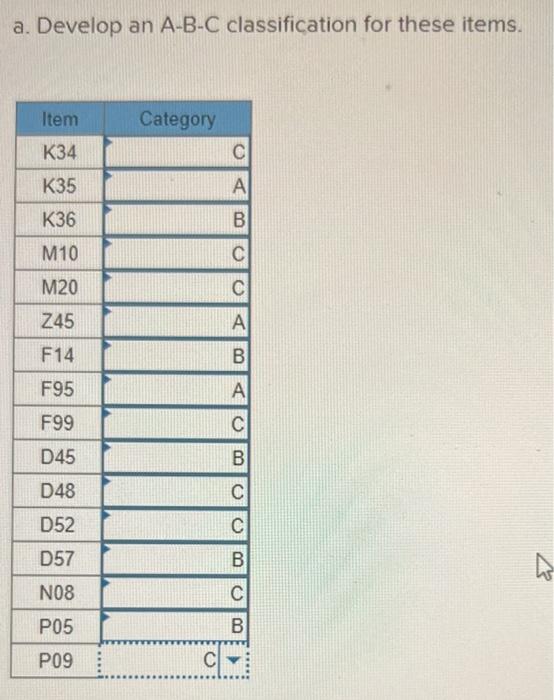
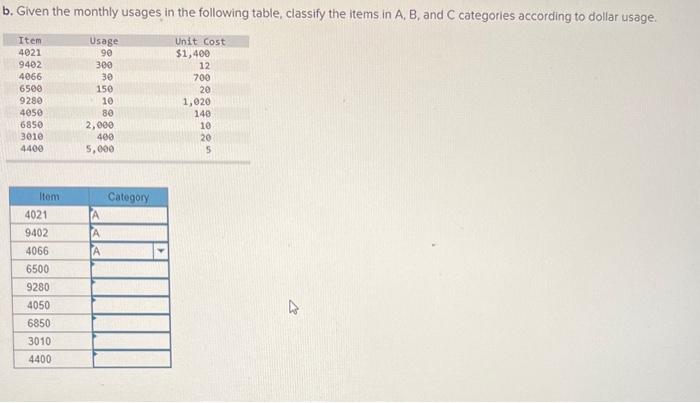
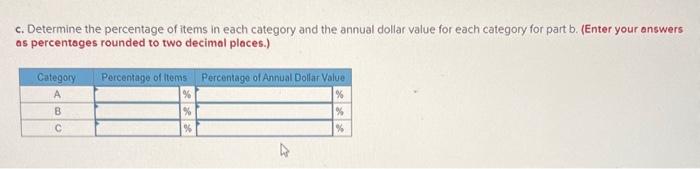
The following table contains figures on the monthly volume and unit costs for a random sample of 16 items from a list of 2,000 inventory items at a health care facility. Click here for the Excel Data File a. Develop an A-B-C classification for these items. a. Develop an A-B-C classification for these items. b. Given the monthly usages in the following table, classify the items in A, B, and C categories according to dollar usage: c. Determine the percentage of items in each category and the annual dollar value for each category for part b. (Enter your answers as percentages rounded to two decimal places.)
Step by Step Solution
There are 3 Steps involved in it
1 Expert Approved Answer
Step: 1 Unlock

Question Has Been Solved by an Expert!
Get step-by-step solutions from verified subject matter experts
Step: 2 Unlock
Step: 3 Unlock