

Question: Can someone please help me with these questions using Matlab? Thank you so much in advance. Plot following function in Matlab over the time. a.
Can someone please help me with these questions using Matlab? Thank you so much in advance.
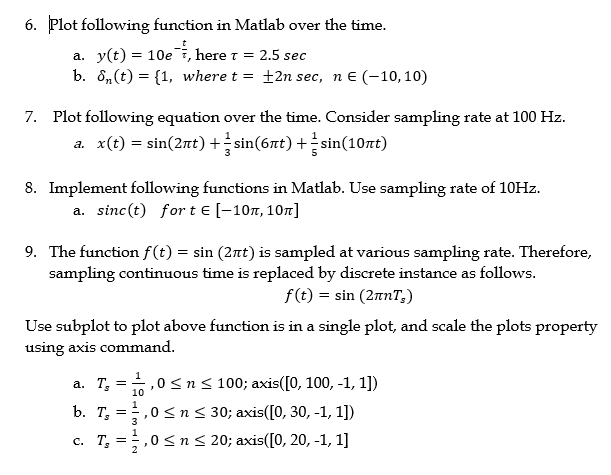
Plot following function in Matlab over the time. a. y(t) = 10e^-t/tau, here tau = 2.5 sec b. delta_n(t) = (1, where t = plusminus 2n sec, n belongsto (-10, 10) Plot following equation over the time. Consider sampling rate at 100 Hz. a. x(t) = sin (2 pi t) + 1/3 sin(6 pi t) + 1/5 sin (10 pi t) Implement following functions in Matlab. Use sampling rate of 10Hz. a. sinc(t) for t belongsto [-10 pi, 10 pi] The function f(t) = sin (2 pi t) is sampled at various sampling rate. Therefore, sampling continuous time is replaced by discrete instance as follows. f(t) = sin (2 pi n T_s) Use subplot to plot above function is in a single plot, and scale the plots property using command. a. T_s = 1/10, 0 lessthanorequalto n lessthanorequalto 100: axis ([0, 100, -1, 1]) b. T_s = 1/3, 0 lessthanorequalto n lessthanorequalto 30: axis ([0, 30, -1, 1]) c. T_s = 1/2, 0 lessthanorequalto n lessthanorequalto 20: axis ([0, 20, -1, 1]
Step by Step Solution
There are 3 Steps involved in it

Get step-by-step solutions from verified subject matter experts