

Question: Can someone please help me with this? It's something about control limit. Thanks! 2. The Vimal Engineering Company manufactures truck bearings. Once each hour a
Can someone please help me with this? It's something about control limit. Thanks!
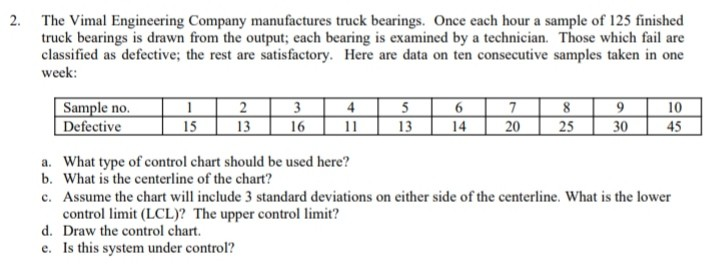
2. The Vimal Engineering Company manufactures truck bearings. Once each hour a sample of 125 finished truck bearings is drawn from the output; each bearing is examined by a technician. Those which fail are classified as defective; the rest are satisfactory. Here are data on ten consecutive samples taken in one week: Sample no. 2 5 6 7 8 9 10 Defective 15 13 16 11 13 14 20 25 30 45 a. What type of control chart should be used here? b. What is the centerline of the chart? c. Assume the chart will include 3 standard deviations on either side of the centerline. What is the lower control limit (LCL)? The upper control limit? d. Draw the control chart. e. Is this system under controlStep by Step Solution
There are 3 Steps involved in it
1 Expert Approved Answer
Step: 1 Unlock

Question Has Been Solved by an Expert!
Get step-by-step solutions from verified subject matter experts
Step: 2 Unlock
Step: 3 Unlock