

Question: Can someone please help me with this question using the data provided in the excel sheet below? My assigned year is 1964. (5 pts) Go
Can someone please help me with this question using the data provided in the excel sheet below? My assigned year is 1964.
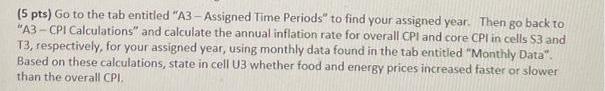
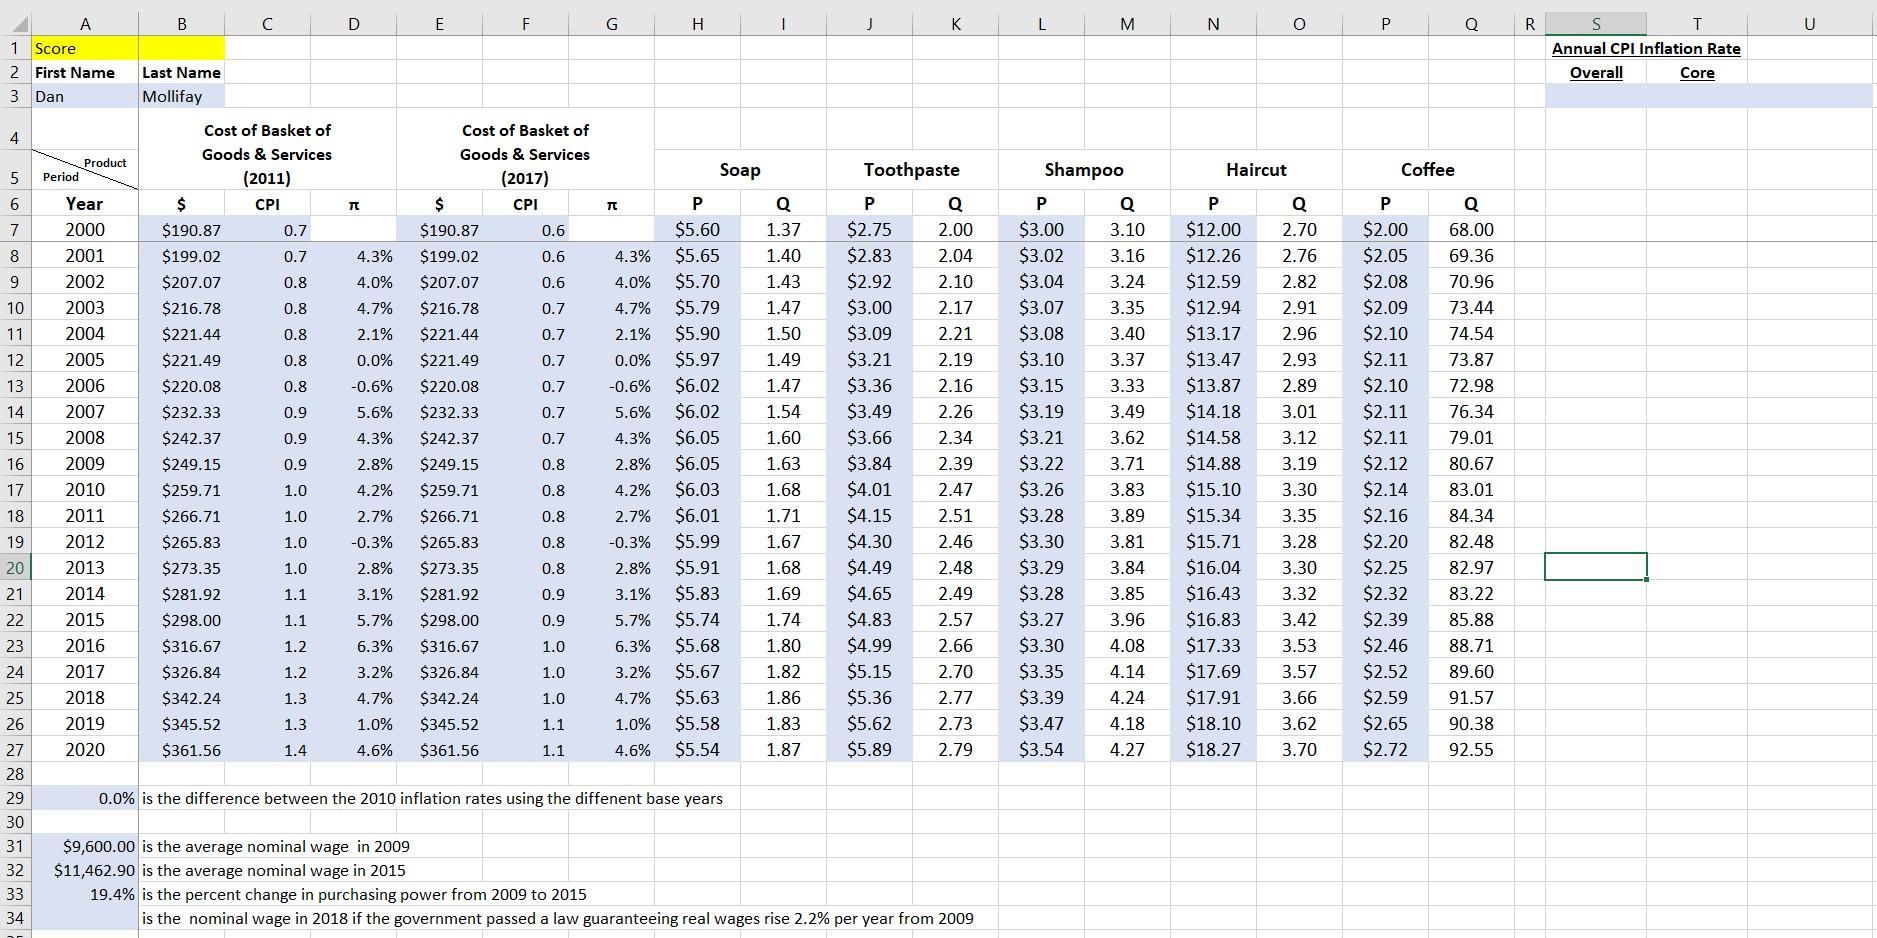
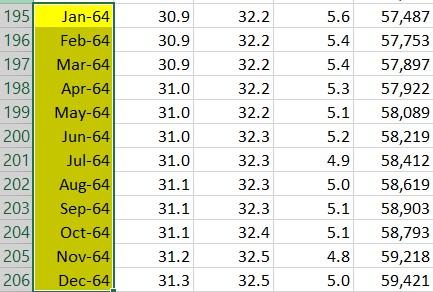
(5 pts) Go to the tab entitled "A3 - Assigned Time Periods" to find your assigned year. Then go back to "A3-CPI Calculations and calculate the annual inflation rate for overall CPI and core CPi in cells $3 and T3, respectively, for your assigned year, using monthly data found in the tab entitled "Monthly Data". Based on these calculations, state in cell U3 whether food and energy prices increased faster or slower than the overall CPI. B D E F H 1 J K L M N O Q R U A 1 Score 2 First Name 3 Dan T Annual CPI Inflation Rate Overall Core Last Name Mollifay 4 5 Product Period Soap Toothpaste Shampoo Haircut Coffee 6 Q Q 7 8 9 4.3% 4.0% 4.7% 10 11 12 13 Year 2000 2001 2002 2003 2004 2005 2006 2007 2008 2009 2010 2011 2012 2013 2014 2015 4.3% 4.0% 4.7% 2.1% 0.0% -0.6% 5.6% 4.3% 2.8% 4.2% Cost of Basket of Goods & Services (2011) $ CPI $190.87 0.7 $199.02 0.7 $207.07 0.8 $216.78 0.8 $221.44 0.8 $221.49 0.8 $220.08 0.8 $232.33 0.9 $242.37 0.9 $249.15 0.9 $259.71 1.0 $266.71 1.0 $265.83 1.0 $273.35 1.0 $281.92 1.1 $298.00 1.1 $316.67 1.2 $326.84 1.2 $342.24 1.3 $345.52 1.3 $361.56 1.4 14 2.1% 0.0% -0.6% 5.6% 4.3% Cost of Basket of Goods & Services (2017) $ $190.87 0.6 $199.02 0.6 $207.07 0.6 $216.78 0.7 $221.44 0.7 $221.49 0.7 $220.08 0.7 $232.33 0.7 $242.37 0.7 $249.15 0.8 $259.71 0.8 $266.71 0.8 $265.83 0.8 $273.35 0.8 $281.92 0.9 $298.00 0.9 $316.67 1.0 $326.84 1.0 $342.24 1.0 $345.52 1.1 $361.56 1.1 15 P $2.75 $2.83 $2.92 $3.00 $3.09 $3.21 $3.36 $3.49 $3.66 $3.84 $4.01 $4.15 $4.30 $4.49 $4.65 16 $5.60 $5.65 $5.70 $5.79 $5.90 $5.97 $6.02 $6.02 $6.05 $6.05 $6.03 $6.01 $5.99 $5.91 $5.83 $5.74 $5.68 $5.67 $5.63 $5.58 $5.54 2.8% 4.2% 1.37 1.40 1.43 1.47 1.50 1.49 1.47 1.54 1.60 1.63 1.68 1.71 1.67 1.68 1.69 1.74 1.80 1.82 1.86 1.83 1.87 P $3.00 $3.02 $3.04 $3.07 $3.08 $3.10 $3.15 $3.19 $3.21 $3.22 $3.26 $3.28 $3.30 $3.29 $3.28 $3.27 $3.30 $3.35 $3.39 $3.47 $3.54 2.00 2.04 2.10 2.17 2.21 2.19 2.16 2.26 2.34 2.39 2.47 2.51 2.46 2.48 2.49 2.57 2.66 2.70 2.77 2.73 2.79 Q 3.10 3.16 3.24 3.35 3.40 3.37 3.33 3.49 3.62 3.71 3.83 3.89 3.81 3.84 3.85 3.96 4.08 4.14 4.24 4.18 4.27 P $12.00 $12.26 $12.59 $12.94 $13.17 $13.47 $13.87 $14.18 $14.58 $14.88 $15.10 $15.34 $15.71 $16.04 $16.43 $16.83 $17.33 $17.69 $17.91 $18.10 $18.27 Q 2.70 2.76 2.82 2.91 2.96 2.93 2.89 3.01 3.12 3.19 3.30 3.35 3.28 3.30 3.32 3.42 3.53 3.57 3.66 3.62 3.70 P $2.00 $2.05 $2.08 $2.09 $2.10 $2.11 $2.10 $2.11 $2.11 $2.12 $2.14 $2.16 $2.20 $2.25 $2.32 $2.39 $2.46 $2.52 $2.59 $2.65 $2.72 17 18 Q 68.00 69.36 70.96 73.44 74.54 73.87 72.98 76.34 79.01 80.67 83.01 84.34 82.48 82.97 83.22 85.88 88.71 89.60 91.57 90.38 92.55 2.7% 19 20 2.7% -0.3% 2.8% 21 22 23 $4.83 -0.3% 2.8% 3.1% 5.7% 6.3% 3.2% 4.7% 3.1% 5.7% 6.3% 3.2% 2016 24 25 26 2017 2018 2019 2020 4.7% 1.0% 4.6% $4.99 $5.15 $5.36 $5.62 $5.89 1.0% 4.6% 0.0% is the difference between the 2010 inflation rates using the diffenent base years 27 28 29 30 31 32 33 34 $9,600.00 is the average nominal wage in 2009 $11,462.90 is the average nominal wage in 2015 19.4% is the percent change in purchasing power from 2009 to 2015 is the nominal wage in 2018 if the government passed a law guaranteeing real wages rise 2.2% per year from 2009 195 196 197 198 199 200 201 202 203 204 205 206 Jan-64 Feb-64 Mar-64 Apr-64 May-64 Jun-64 Jul-64 Aug-64 Sep-64 Oct-64 Nov-64 Dec-64 30.9 30.9 30.9 31.0 31.0 31.0 31.0 31.1 31.1 31.1 31.2 31.3 32.2 32.2 32.2 32.2 32.2 32.3 32.3 32.3 32.3 32.4 32.5 32.5 5.6 5.4 5.4 5.3 5.1 5.2 4.9 5.0 5.1 5.1 4.8 5.0 57,487 57,753 57,897 57,922 58,089 58,219 58,412 58,619 58,903 58,793 59,218 59,421 (5 pts) Go to the tab entitled "A3 - Assigned Time Periods" to find your assigned year. Then go back to "A3-CPI Calculations and calculate the annual inflation rate for overall CPI and core CPi in cells $3 and T3, respectively, for your assigned year, using monthly data found in the tab entitled "Monthly Data". Based on these calculations, state in cell U3 whether food and energy prices increased faster or slower than the overall CPI. B D E F H 1 J K L M N O Q R U A 1 Score 2 First Name 3 Dan T Annual CPI Inflation Rate Overall Core Last Name Mollifay 4 5 Product Period Soap Toothpaste Shampoo Haircut Coffee 6 Q Q 7 8 9 4.3% 4.0% 4.7% 10 11 12 13 Year 2000 2001 2002 2003 2004 2005 2006 2007 2008 2009 2010 2011 2012 2013 2014 2015 4.3% 4.0% 4.7% 2.1% 0.0% -0.6% 5.6% 4.3% 2.8% 4.2% Cost of Basket of Goods & Services (2011) $ CPI $190.87 0.7 $199.02 0.7 $207.07 0.8 $216.78 0.8 $221.44 0.8 $221.49 0.8 $220.08 0.8 $232.33 0.9 $242.37 0.9 $249.15 0.9 $259.71 1.0 $266.71 1.0 $265.83 1.0 $273.35 1.0 $281.92 1.1 $298.00 1.1 $316.67 1.2 $326.84 1.2 $342.24 1.3 $345.52 1.3 $361.56 1.4 14 2.1% 0.0% -0.6% 5.6% 4.3% Cost of Basket of Goods & Services (2017) $ $190.87 0.6 $199.02 0.6 $207.07 0.6 $216.78 0.7 $221.44 0.7 $221.49 0.7 $220.08 0.7 $232.33 0.7 $242.37 0.7 $249.15 0.8 $259.71 0.8 $266.71 0.8 $265.83 0.8 $273.35 0.8 $281.92 0.9 $298.00 0.9 $316.67 1.0 $326.84 1.0 $342.24 1.0 $345.52 1.1 $361.56 1.1 15 P $2.75 $2.83 $2.92 $3.00 $3.09 $3.21 $3.36 $3.49 $3.66 $3.84 $4.01 $4.15 $4.30 $4.49 $4.65 16 $5.60 $5.65 $5.70 $5.79 $5.90 $5.97 $6.02 $6.02 $6.05 $6.05 $6.03 $6.01 $5.99 $5.91 $5.83 $5.74 $5.68 $5.67 $5.63 $5.58 $5.54 2.8% 4.2% 1.37 1.40 1.43 1.47 1.50 1.49 1.47 1.54 1.60 1.63 1.68 1.71 1.67 1.68 1.69 1.74 1.80 1.82 1.86 1.83 1.87 P $3.00 $3.02 $3.04 $3.07 $3.08 $3.10 $3.15 $3.19 $3.21 $3.22 $3.26 $3.28 $3.30 $3.29 $3.28 $3.27 $3.30 $3.35 $3.39 $3.47 $3.54 2.00 2.04 2.10 2.17 2.21 2.19 2.16 2.26 2.34 2.39 2.47 2.51 2.46 2.48 2.49 2.57 2.66 2.70 2.77 2.73 2.79 Q 3.10 3.16 3.24 3.35 3.40 3.37 3.33 3.49 3.62 3.71 3.83 3.89 3.81 3.84 3.85 3.96 4.08 4.14 4.24 4.18 4.27 P $12.00 $12.26 $12.59 $12.94 $13.17 $13.47 $13.87 $14.18 $14.58 $14.88 $15.10 $15.34 $15.71 $16.04 $16.43 $16.83 $17.33 $17.69 $17.91 $18.10 $18.27 Q 2.70 2.76 2.82 2.91 2.96 2.93 2.89 3.01 3.12 3.19 3.30 3.35 3.28 3.30 3.32 3.42 3.53 3.57 3.66 3.62 3.70 P $2.00 $2.05 $2.08 $2.09 $2.10 $2.11 $2.10 $2.11 $2.11 $2.12 $2.14 $2.16 $2.20 $2.25 $2.32 $2.39 $2.46 $2.52 $2.59 $2.65 $2.72 17 18 Q 68.00 69.36 70.96 73.44 74.54 73.87 72.98 76.34 79.01 80.67 83.01 84.34 82.48 82.97 83.22 85.88 88.71 89.60 91.57 90.38 92.55 2.7% 19 20 2.7% -0.3% 2.8% 21 22 23 $4.83 -0.3% 2.8% 3.1% 5.7% 6.3% 3.2% 4.7% 3.1% 5.7% 6.3% 3.2% 2016 24 25 26 2017 2018 2019 2020 4.7% 1.0% 4.6% $4.99 $5.15 $5.36 $5.62 $5.89 1.0% 4.6% 0.0% is the difference between the 2010 inflation rates using the diffenent base years 27 28 29 30 31 32 33 34 $9,600.00 is the average nominal wage in 2009 $11,462.90 is the average nominal wage in 2015 19.4% is the percent change in purchasing power from 2009 to 2015 is the nominal wage in 2018 if the government passed a law guaranteeing real wages rise 2.2% per year from 2009 195 196 197 198 199 200 201 202 203 204 205 206 Jan-64 Feb-64 Mar-64 Apr-64 May-64 Jun-64 Jul-64 Aug-64 Sep-64 Oct-64 Nov-64 Dec-64 30.9 30.9 30.9 31.0 31.0 31.0 31.0 31.1 31.1 31.1 31.2 31.3 32.2 32.2 32.2 32.2 32.2 32.3 32.3 32.3 32.3 32.4 32.5 32.5 5.6 5.4 5.4 5.3 5.1 5.2 4.9 5.0 5.1 5.1 4.8 5.0 57,487 57,753 57,897 57,922 58,089 58,219 58,412 58,619 58,903 58,793 59,218 59,421
Step by Step Solution
There are 3 Steps involved in it

Get step-by-step solutions from verified subject matter experts