

Question: Can someone please show me how to make the graph like the one in the first picture? 580 Yellow Blue-violet 610 Orange Blue 680 Red
Can someone please show me how to make the graph like the one in the first picture?
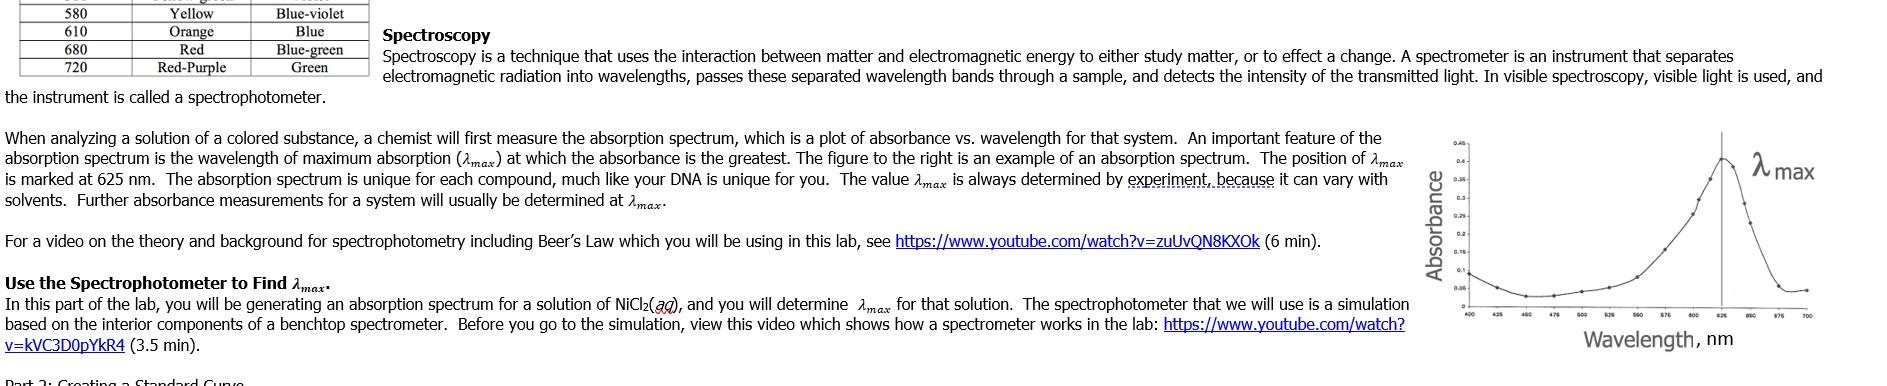
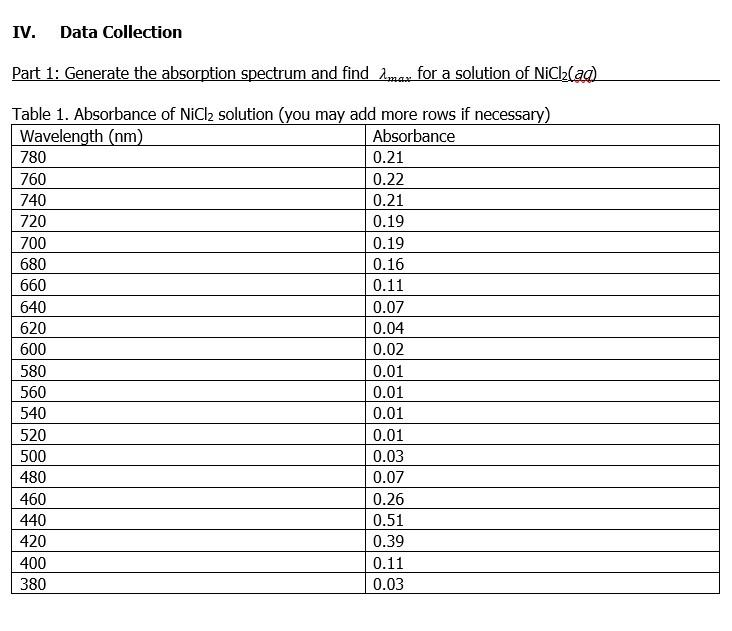
580 Yellow Blue-violet 610 Orange Blue 680 Red Blue-green 720 Red-Purple Green the instrument is called a spectrophotometer. Spectroscopy Spectroscopy is a technique that uses the interaction between matter and electromagnetic energy to either study matter, or to effect a change. A spectrometer is an instrument that separates electromagnetic radiation into wavelengths, passes these separated wavelength bands through a sample, and detects the intensity of the transmitted light. In visible spectroscopy, visible light is used, and When analyzing a solution of a colored substance, a chemist will first measure the absorption spectrum, which is a plot of absorbance vs. wavelength for that system. An important feature of the absorption spectrum is the wavelength of maximum absorption (Imax) at which the absorbance is the greatest. The figure to the right is an example of an absorption spectrum. The position of imax is marked at 625 nm. The absorption spectrum is unique for each compound, much like your DNA is unique for you. The value Imax is always determined by experiment, because it can vary with solvents. Further absorbance measurements for a system will usually be determined at imax 2 max Absorbance For a video on the theory and background for spectrophotometry including Beer's Law which you will be using in this lab, see https://www.youtube.com/watch?v=zuUVQN8KXOk (6 min). Use the Spectrophotometer to Find a max. In this part of the lab, you will be generating an absorption spectrum for a solution of NiCl(aq), and you will determine imax for that solution. The spectrophotometer that we will use is a simulation based on the interior components of a benchtop spectrometer. Before you go to the simulation, view this video which shows how a spectrometer works in the lab: https://www.youtube.com/watch? v=KVC3D0pYkR4 (3.5 min). 476 Wavelength, nm Dart. Crestinactandard IV. Data Collection Part 1: Generate the absorption spectrum and find max for a solution of NiCl(aq) Table 1. Absorbance of NiCl2 solution (you may add more rows if necessary) Wavelength (nm) Absorbance 780 0.21 760 0.22 740 0.21 720 0.19 700 0.19 680 0.16 660 0.11 640 0.07 620 0.04 600 0.02 580 0.01 560 0.01 540 0.01 520 0.01 500 0.03 480 0.07 460 0.26 440 0.51 420 0.39 400 0.11 380 0.03
Step by Step Solution
There are 3 Steps involved in it

Get step-by-step solutions from verified subject matter experts