

Question: Can someone please show this in excel with the formulas? And the company being Apple Inc. This assignment will be your first step into the
 Can someone please show this in excel with the formulas? And the company being Apple Inc.
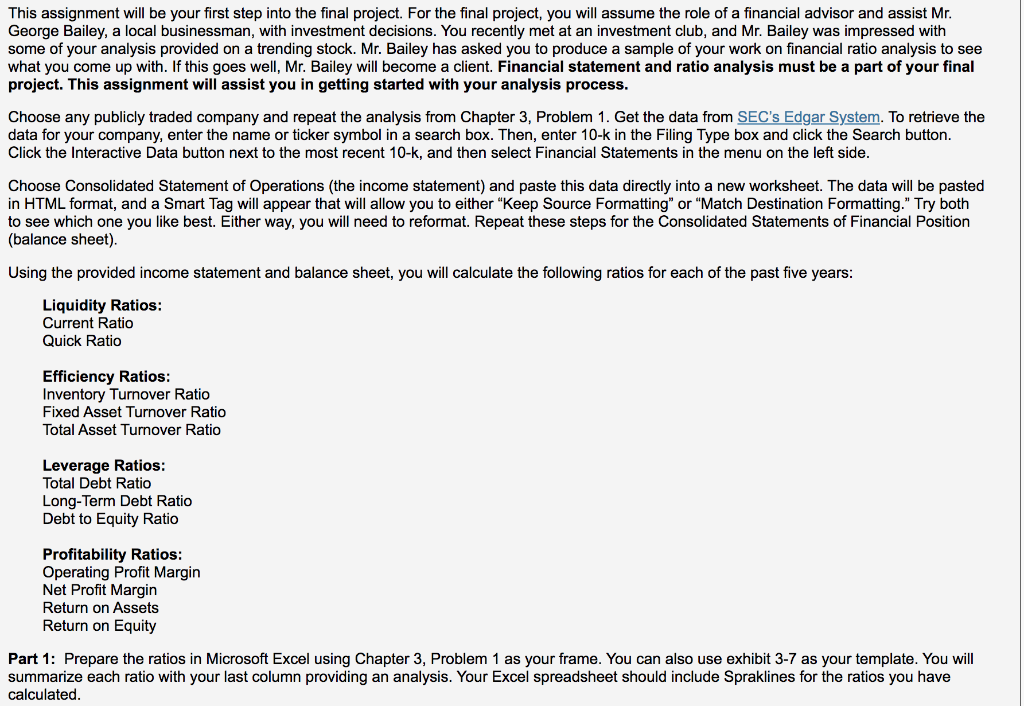
This assignment will be your first step into the final project. For the final project, you will assume the role of a financial advisor and assist Mr. George Bailey, a local businessman, with investment decisions. You recently met at an investment club, and Mr. Bailey was impressed with some of your analysis provided on a trending stock. Mr. Bailey has asked you to produce a sample of your work on financial ratio analysis to see what you come up with. If this goes well, Mr. Bailey will become a client. Financial statement and ratio analysis must be a part of your final project. This assignment will assist you in getting started with your analysis process. Choose any publicly traded company and repeat the analysis from Chapter 3, Problem 1. Get the data from To retrieve the data for your company, enter the name or ticker symbol in a search box. Then, enter 10-k in the Filing Type box and click the Search button. Click the Interactive Data button next to the most recent 10-k, and then select Financial Statements in the menu on the left side. Choose Consolidated Statement of Operations (the income statement) and paste this data directly into a new worksheet. The data will be pasted in HTML format, and a Smart Tag will appear that will allow you to either "Keep Source Formatting" or "Match Destination Formatting." Try both to see which one you like best. Either way, you will need to reformat. Repeat these steps for the Consolidated Statements of Financial Position (balance sheet). Using the provided income statement and balance sheet, you will calculate the following ratios for each of the past five years: Liquidity Ratios: Current Ratio Quick Ratio Efficiency Ratios: Inventory Turnover Ratio Fixed Asset Turnover Ratio Total Asset Turnover Ratio Leverage Ratios: Total Debt Ratio Long-Term Debt Ratio Debt to Equity Ratio Profitability Ratios: Operating Profit Margin Net Profit Margin Return on Assets Return on Equity Part 1: Prepare the ratios in Microsoft Excel using Chapter 3, Problem 1 as your frame. You can also use exhibit 3-7 as your template. You will summarize each ratio with your last column providing an analysis. Your Excel spreadsheet should include Spraklines for the ratios you have calculated. This assignment will be your first step into the final project. For the final project, you will assume the role of a financial advisor and assist Mr. George Bailey, a local businessman, with investment decisions. You recently met at an investment club, and Mr. Bailey was impressed with some of your analysis provided on a trending stock. Mr. Bailey has asked you to produce a sample of your work on financial ratio analysis to see what you come up with. If this goes well, Mr. Bailey will become a client. Financial statement and ratio analysis must be a part of your final project. This assignment will assist you in getting started with your analysis process. Choose any publicly traded company and repeat the analysis from Chapter 3, Problem 1. Get the data from To retrieve the data for your company, enter the name or ticker symbol in a search box. Then, enter 10-k in the Filing Type box and click the Search button. Click the Interactive Data button next to the most recent 10-k, and then select Financial Statements in the menu on the left side. Choose Consolidated Statement of Operations (the income statement) and paste this data directly into a new worksheet. The data will be pasted in HTML format, and a Smart Tag will appear that will allow you to either "Keep Source Formatting" or "Match Destination Formatting." Try both to see which one you like best. Either way, you will need to reformat. Repeat these steps for the Consolidated Statements of Financial Position (balance sheet). Using the provided income statement and balance sheet, you will calculate the following ratios for each of the past five years: Liquidity Ratios: Current Ratio Quick Ratio Efficiency Ratios: Inventory Turnover Ratio Fixed Asset Turnover Ratio Total Asset Turnover Ratio Leverage Ratios: Total Debt Ratio Long-Term Debt Ratio Debt to Equity Ratio Profitability Ratios: Operating Profit Margin Net Profit Margin Return on Assets Return on Equity Part 1: Prepare the ratios in Microsoft Excel using Chapter 3, Problem 1 as your frame. You can also use exhibit 3-7 as your template. You will summarize each ratio with your last column providing an analysis. Your Excel spreadsheet should include Spraklines for the ratios you have calculated
Step by Step Solution
There are 3 Steps involved in it

Get step-by-step solutions from verified subject matter experts