

Question: Can someone please work this out on Excel? Its due midnight! 1. You want to form 2-asset portfolio using WMT and PII stocks. Based on
Can someone please work this out on Excel? Its due midnight! 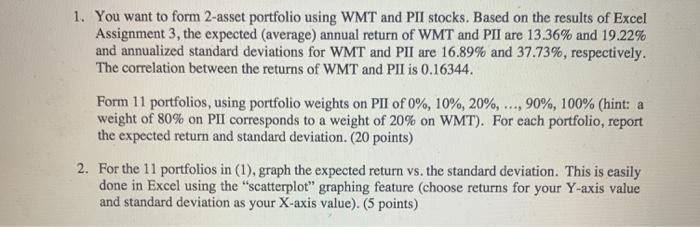
1. You want to form 2-asset portfolio using WMT and PII stocks. Based on the results of Excel Assignment 3, the expected (average) annual return of WMT and PII are 13.36% and 19.22% and annualized standard deviations for WMT and PII are 16.89% and 37.73%, respectively. The correlation between the returns of WMT and PII is 0.16344. Form 11 portfolios, using portfolio weights on PII of 0%, 10%, 20%, ..., 90%, 100% (hint: a weight of 80% on PII corresponds to a weight of 20% on WMT). For each portfolio, report the expected return and standard deviation. (20 points) 2. For the 11 portfolios in (1), graph the expected return vs. the standard deviation. This is easily done in Excel using the "scatterplot" graphing feature (choose returns for your Y-axis value and standard deviation as your X-axis value). (5 points)
Step by Step Solution
There are 3 Steps involved in it

Get step-by-step solutions from verified subject matter experts