

Question: can someone plot the needed graphs using excel Decsending Mass a. gauge pressure vs. actual pressure. (both increasing and decreasing) Hint: Plotting a line of
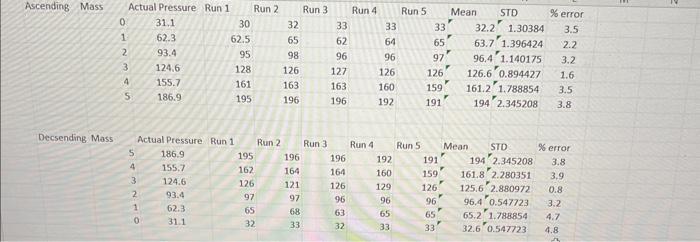
Decsending Mass a. gauge pressure vs. actual pressure. (both increasing and decreasing) Hint: Plotting a line of slope 1 on this graph will allow you to easily determine whether the gauge is overestimating or underestimating the actual pressure. b. gauge error vs. actual pressure. (both increasing and decreasing) c. standard deviation vs. actual pressure. (both increasing and decreasing) Comment on errors such as scale being marked off incorrectly (this error increases with pressure) or friction between cylinder and piston, which will yield smaller gauge reading when pressure is increasing then when it is decreasing. 6. Comment on the fluctuations of your measurements and the repeatability of the experiment. 7. Define the term hysteresis and how it relates to the graphs previously made
Step by Step Solution
There are 3 Steps involved in it

Get step-by-step solutions from verified subject matter experts