

Question: can someone show me how to make an excel spreadsheet / graph using the information below? 1-propanol temp pressure begin{tabular}{l|l} 296k & 518mmHy 368k
can someone show me how to make an excel spreadsheet / graph using the information below? 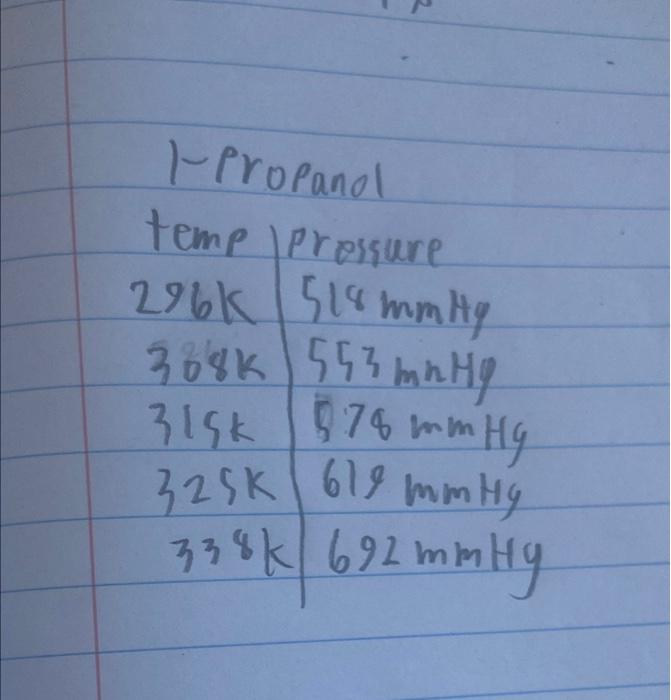
1-propanol temp pressure \begin{tabular}{l|l} 296k & 518mmHy \\ 368k & 553mhHg \\ 315k & 578mmHy \\ 325K & 619mmHy \\ 338k & 692mmHy \end{tabular}
Step by Step Solution
There are 3 Steps involved in it
1 Expert Approved Answer
Step: 1 Unlock

Question Has Been Solved by an Expert!
Get step-by-step solutions from verified subject matter experts
Step: 2 Unlock
Step: 3 Unlock