

Question: Can someone solve the following problem. The code must be in matlab or python. We will use the NASA HORIZONS website to obtain the required
Can someone solve the following problem. The code must be in matlab or python.
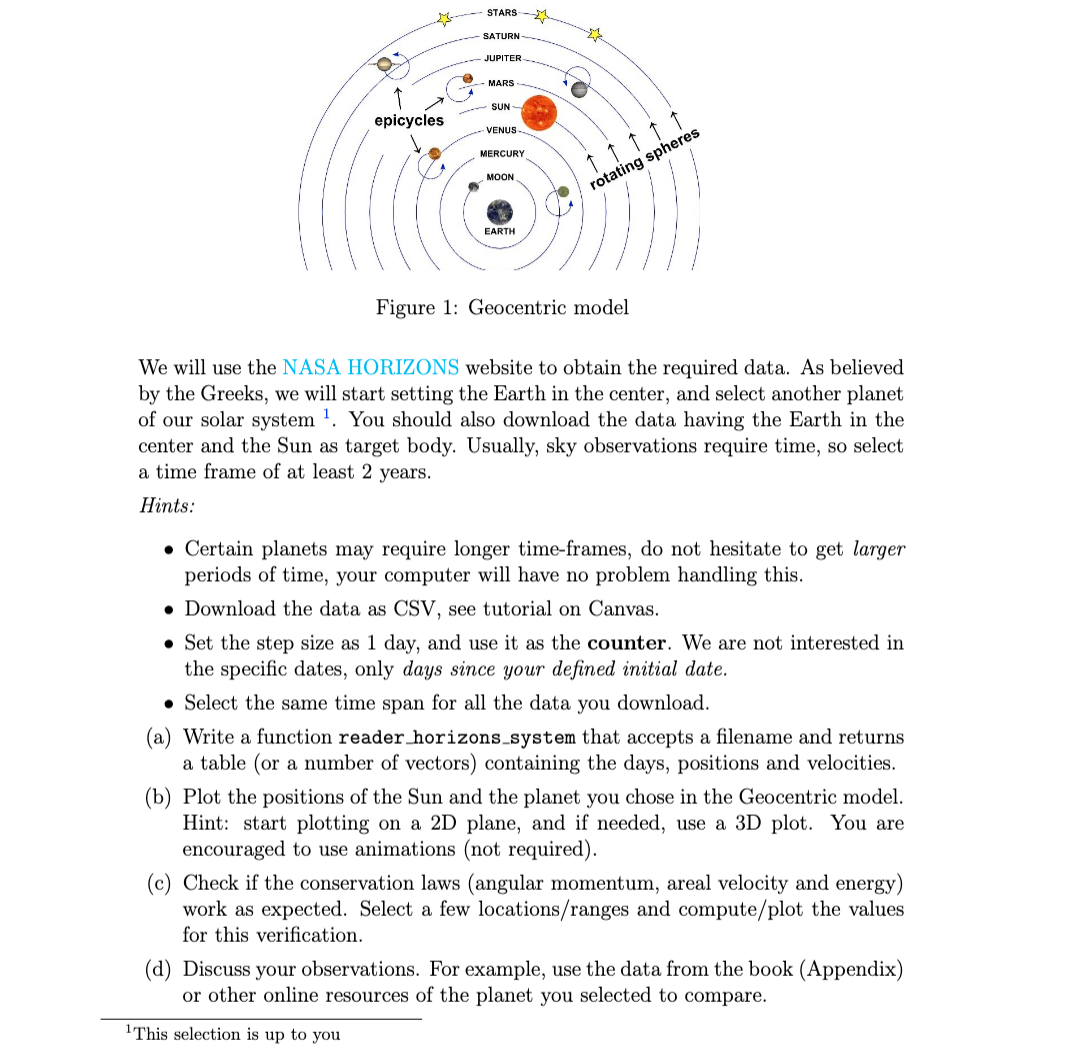
We will use the NASA HORIZONS website to obtain the required data. As believed by the Greeks, we will start setting the Earth in the center, and select another planet of our solar system. You should also download the data having the Earth in the center and the Sun as target body. Usually, sky observations require time, so select a time frame of at least years.
Hints:
Certain planets may require longer timeframes, do not hesitate to get larger periods of time, your computer will have no problem handling this.
Download the data as CSV see tutorial on Canvas.
Set the step size as day, and use it as the counter. We are not interested in the specific dates, only days since your defined initial date.
Select the same time span for all the data you download.
a Write a function reader horizons system that accepts a filename and returns a table or a number of vectors containing the days, positions and velocities.
b Plot the positions of the Sun and the planet you chose in the Geocentric model.
Hint: start plotting on a D plane, and if needed, use a D plot. You are
encouraged to use animations not required
c Check if the conservation laws angular momentum, areal velocity and energy work as expected. Select a few locationsranges and computeplot the values for this verification.
d Discuss your observations. For example, use the data from the book Appendix or other online resources of the planet you selected to compare.
Step by Step Solution
There are 3 Steps involved in it
1 Expert Approved Answer
Step: 1 Unlock

Question Has Been Solved by an Expert!
Get step-by-step solutions from verified subject matter experts
Step: 2 Unlock
Step: 3 Unlock