

Question: Can someone solve these problems in Excel? 7.2 A coffee manufacturer imports green coffee beans from several countries and suppliers. Beans are usually shipped by
Can someone solve these problems in Excel? 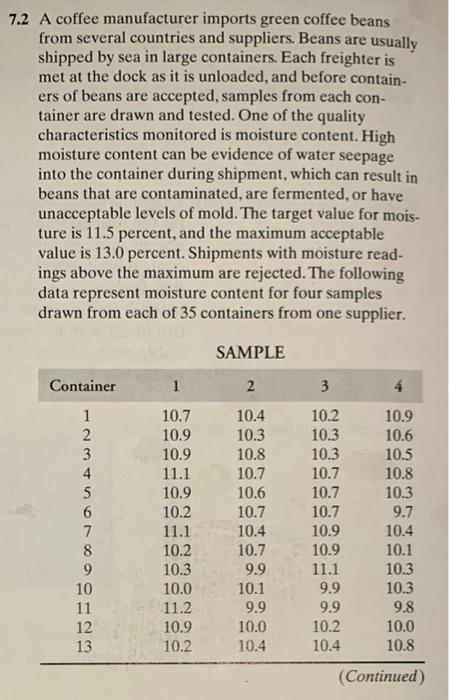
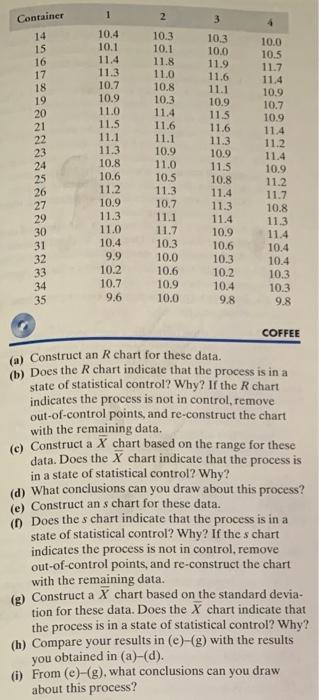
7.2 A coffee manufacturer imports green coffee beans from several countries and suppliers. Beans are usually shipped by sea in large containers. Each freighter is met at the dock as it is unloaded, and before contain- ers of beans are accepted, samples from each con- tainer are drawn and tested. One of the quality characteristics monitored is moisture content. High moisture content can be evidence of water seepage into the container during shipment, which can result in beans that are contaminated, are fermented, or have unacceptable levels of mold. The target value for mois- ture is 11.5 percent, and the maximum acceptable value is 13.0 percent. Shipments with moisture read- ings above the maximum are rejected. The following data represent moisture content for four samples drawn from each of 35 containers from one supplier. SAMPLE Container 2 3 2 3 4 5 6 7 8 9 10 11 12 13 So van WN- 10.7 10.9 10.9 11.1 10.9 10.2 11.1 10.2 10.3 10.0 11.2 10.9 10.2 10.4 10.3 10.8 10.7 10.6 10.7 10.4 10.7 9.9 10.1 9.9 10.0 10.4 10.2 10.3 10.3 10.7 10.7 10.7 10.9 10.9 11.1 9.9 9.9 10.2 10.4 10.9 10.6 10.5 10.8 10.3 9.7 10.4 10.1 10.3 10.3 9.8 10.0 10.8 (Continued) 1 2 3 Container 14 15 16 17 18 19 20 21 22 23 24 25 26 27 29 30 31 32 33 34 35 10.4 10.1 11.4 11.3 10.7 10.9 11.0 11.5 11.1 11.3 10.8 10.6 11.2 10.9 11.3 11.0 10.4 9.9 10.2 10.7 9,6 10.3 10.1 11.8 11.0 10.8 10.3 11.4 11.6 11.1 10.9 11.0 10.5 11.3 10.7 11.1 11.7 10.3 10.0 10.6 10.9 10.0 10.3 10.0 11.9 11.6 11.1 10.9 11.5 11.6 11.3 10.9 11.5 10.8 11.4 11.3 11.4 10.9 10.6 10.3 10.2 10.4 9.8 10.0 10.5 11.7 11.4 10.9 10.7 10.9 11.4 11.2 11.4 10.9 11.2 11.7 10.8 11.3 11.4 10.4 10.4 10.3 10.3 9.8 COFFEE (a) Construct an R chart for these data. 6) Does the R chart indicate that the process is in a state of statistical control? Why? If the R chart indicates the process is not in control remove out-of-control points and re-construct the chart with the remaining data. (c) Construct a X chart based on the range for these data. Does the X chart indicate that the process is in a state of statistical control? Why? (d) What conclusions can you draw about this process? (e) Construct ans chart for these data. Does the s chart indicate that the process is in a state of statistical control? Why? If the chart indicates the process is not in control remove out-of-control points, and re-construct the chart with the remaining data. (g) Construct a X chart based on the standard devia- tion for these data. Does the X chart indicate that the process is in a state of statistical control? Why? (h) Compare your results in (e)-(g) with the results you obtained in (a)-(d). () From (e)-(g), what conclusions can you draw about this process Step by Step Solution
There are 3 Steps involved in it
1 Expert Approved Answer
Step: 1 Unlock

Question Has Been Solved by an Expert!
Get step-by-step solutions from verified subject matter experts
Step: 2 Unlock
Step: 3 Unlock