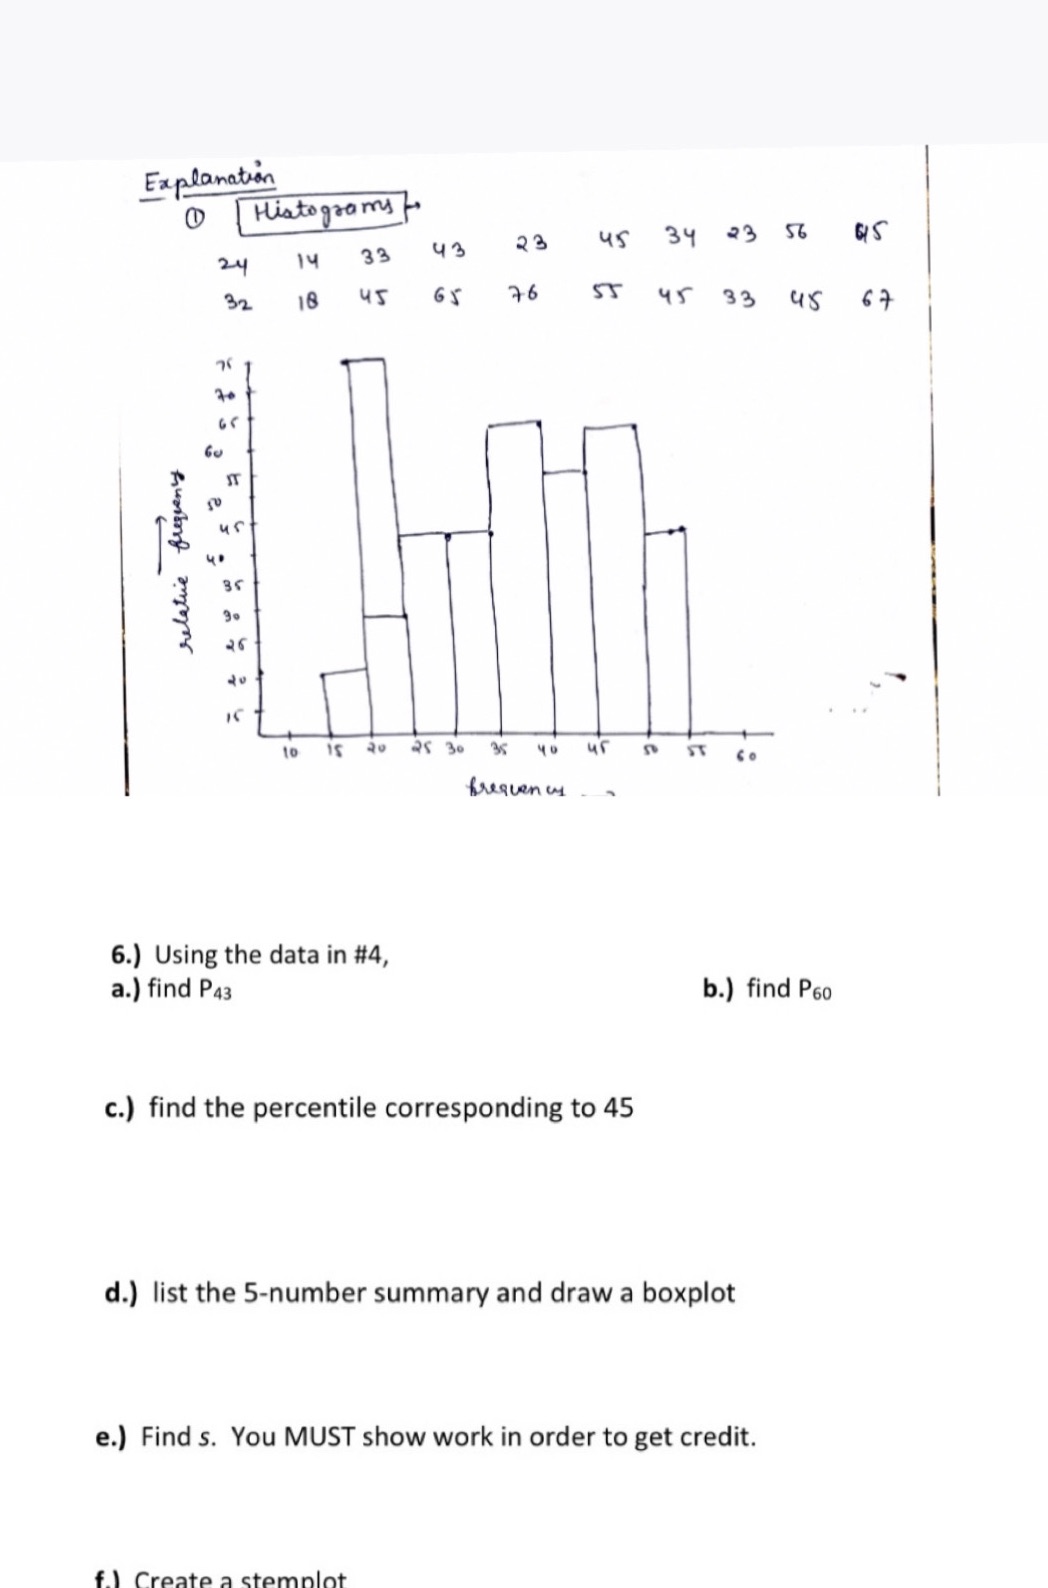
Question: Can someone solve this please Explanation 1 Histograms 43 22 45 34 23 56 65 24 14 33 32 18 45 76 55 45 33

Can someone solve this please

Can someone solve this please Explanation 1
Explanation 1 Histograms 43 22 45 34 23 56 65 24 14 33 32 18 45 76 55 45 33 45 67 70 Go relative frequent 4 0 15 20 25 30 35 40 45 ST co 6.) Using the data in #4, a.) find P43 b.) find P60 c.) find the percentile corresponding to 45 d.) list the 5-number summary and draw a boxplot e.) Find s. You MUST show work in order to get credit

Step by Step Solution

There are 3 Steps involved in it

1 Expert Approved Answer
Step: 1 Unlock blur-text-image
Question Has Been Solved by an Expert!

Get step-by-step solutions from verified subject matter experts

Step: 2 Unlock
Step: 3 Unlock

Students Have Also Explored These Related Mathematics Questions!