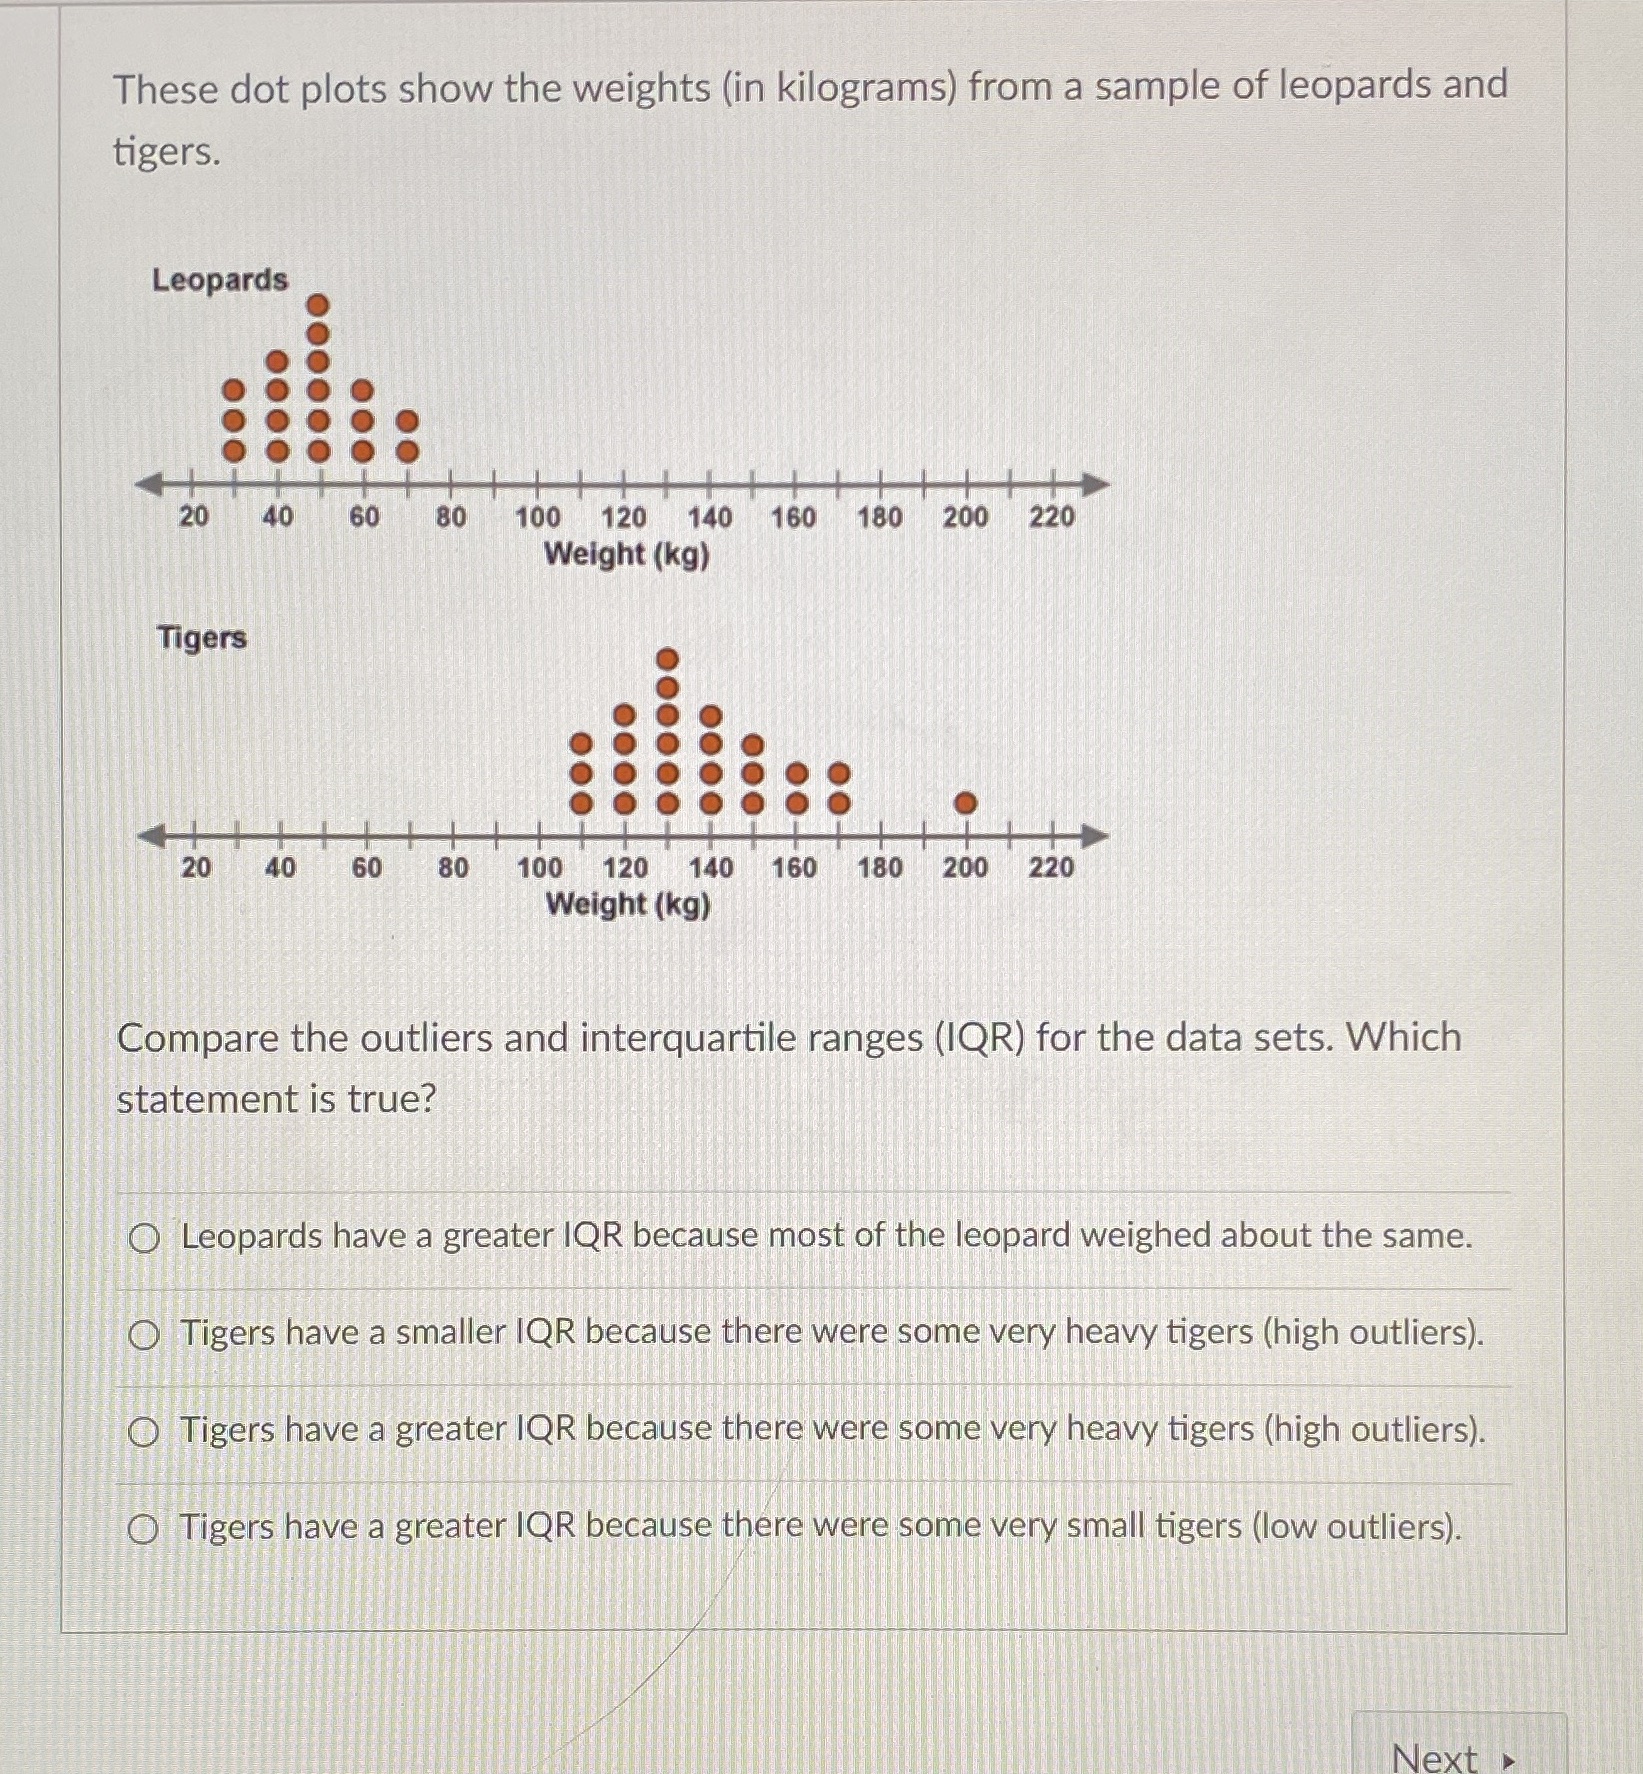
Question: Can u also plz explain how u solved it so I can better understand it These dot plots show the weights (in kilograms) from a

Can u also plz explain how u solved it so I can better understand it

Can u also plz explain how u solved it so I can
These dot plots show the weights (in kilograms) from a sample of leopards and tigers. Leopards 20 40 60 80 100 120 140 160 180 200 220 Weight (kg) Tigers 20 40 60 80 100 120 140 160 180 200 220 Weight (kg) Compare the outliers and interquartile ranges (IQR) for the data sets. Which statement is true? O Leopards have a greater IQR because most of the leopard weighed about the same. O Tigers have a smaller IQR because there were some very heavy tigers (high outliers). O Tigers have a greater IQR because there were some very heavy tigers (high outliers). O Tigers have a greater IQR because there were some very small tigers (low outliers). Next

Step by Step Solution

There are 3 Steps involved in it

1 Expert Approved Answer
Step: 1 Unlock blur-text-image
Question Has Been Solved by an Expert!

Get step-by-step solutions from verified subject matter experts

Step: 2 Unlock
Step: 3 Unlock

Students Have Also Explored These Related Mathematics Questions!