

Question: can u explain and analyse these activity ratios Activity ratio evaluate Walmart Inc.'s effectiveness in managing asset Asset turnover Trend 2018 Walmart Inc. 2019 2020
 can u explain and analyse these activity ratios
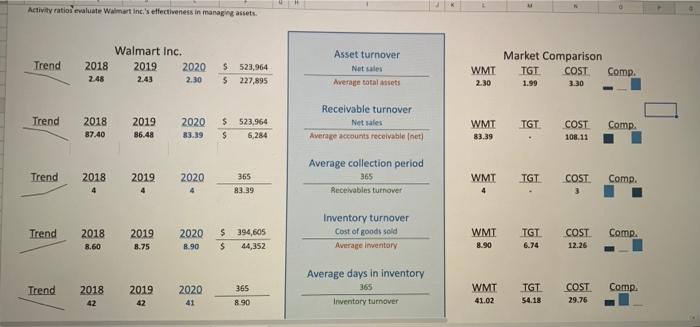
Activity ratio evaluate Walmart Inc.'s effectiveness in managing asset Asset turnover Trend 2018 Walmart Inc. 2019 2020 2.43 2.30 Net sales S523,964 5 227,895 WMT Market Comparison TGT COST Comp. 1.99 248 Average total assets 2.30 3.30 Trend 2018 2019 2020 5523,964 Receivable turnover Net sales Average accounts receivable (net) WMT TGT COST Comp. 87.40 B6.48 83.39 $ 6,284 83.39 108.11 Trend 2018 2019 2020 365 Average collection period 365 Receivables turnover WMT TGT COST Comp. 83.39 4 Inventory turnover Cost of goods sold Trend 2018 2019 2020 $ 394,605 WMT TGT COST 12.26 Comp. 8.60 8.75 8.90 $ 44,352 Average Inventory 8.90 6.74 Trend 2018 2019 2020 365 Average days in inventory 365 Inventory turnover WMT TGT COST Comp. 42 42 41 8.90 29.76 41.02 54.18
Step by Step Solution
There are 3 Steps involved in it

Get step-by-step solutions from verified subject matter experts