

Question: can u please do graph for the frequency vs the percentage QUESTION 2 Your project team carry out Pareto analysis to identify the causes of
can u please do graph for the frequency vs the percentage
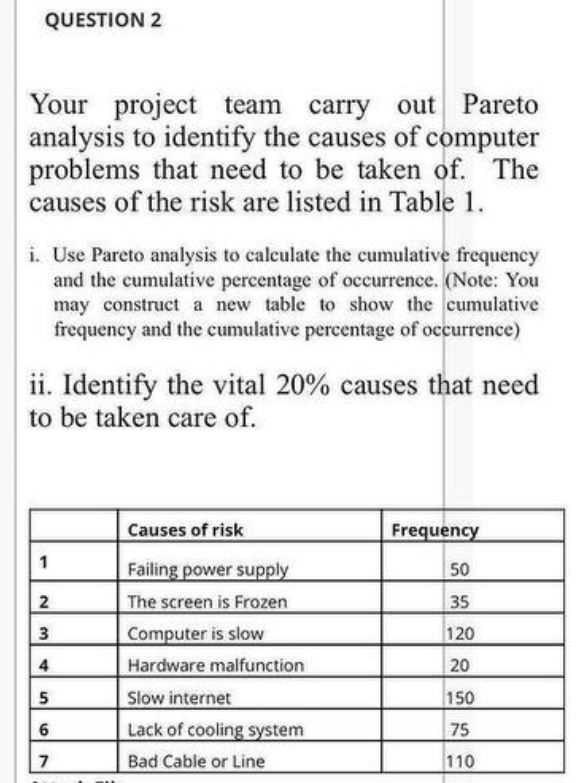
QUESTION 2 Your project team carry out Pareto analysis to identify the causes of computer problems that need to be taken of. The causes of the risk are listed in Table 1. i. Use Pareto analysis to calculate the cumulative frequency and the cumulative percentage of occurrence. (Note: You may construct a new table to show the cumulative frequency and the cumulative percentage of occurrence) ii. Identify the vital 20% causes that need to be taken care of. Causes of risk Frequency 1 50 2 35 3 120 4 Failing power supply The screen is Frozen Computer is slow Hardware malfunction Slow internet Lack of cooling system Bad Cable or Line 20 5 150 6 6 75 17 110Step by Step Solution
There are 3 Steps involved in it
1 Expert Approved Answer
Step: 1 Unlock

Question Has Been Solved by an Expert!
Get step-by-step solutions from verified subject matter experts
Step: 2 Unlock
Step: 3 Unlock