Question: CAN U PLS ANSWER ASAP AND I WILL RATE A THUMBS UP? Question 6 Not yet answered A hospital emergency department is monitoring the time

CAN U PLS ANSWER ASAP AND I WILL RATE A THUMBS UP?CAN U PLS ANSWER ASAP AND I WILL RATE A THUMBS

Question 6 Not yet answered A hospital emergency department is monitoring the time required to admit a patient using x-bar and R charts. A summary data for 20 subgroups of 6 patients each time is in minutes). The overall samples mean (X-double-bar) = 172 and mean of the ranges (R-bar) = 2. If the patient admitting process time seems to follow a normal distribution and if the specifications are at 172 + 5. Marked out of 8.00 p Flag question What is the potential process capability? 120 Chart for Standard Deviations Chart for Ranges Factors for Center Line APPENDIX VI Factors for Constructing Variables Control Charts Chart for Averages Factors for Factors for Observations Control Limits in Center Line Sample, n A A2 Az C4 1/04 2 2.121 1.880 2.659 0.7979 1.2533 3 1.732 1.023 1.954 0.8862 1.1284 4 1.500 0.729 1.628 0.9213 1.0854 5 1.342 0.577 1.427 0.9400 1.0638 6 1.225 0.483 1.287 0.9515 1.0510 7 1.134 0.419 1.182 0.9594 1.0423 8 1.061 0.373 1.099 0.9650 1.0363 9 1.000 0.337 1.032 0.9693 1.0317 10 0.308 0.975 0.9727 1.0281 11 0.905 0.285 0.927 0.9754 1.0252 12 0.866 0.266 0.886 0.9776 1.0229 13 0.832 0.249 0.850 0.9794 1.0210 14 0.802 0.235 0.817 0.9810 1.0194 15 0.775 0.223 0.789 0.9823 1.0180 16 0.750 0.212 0.763 0.9835 1.0168 17 0.728 0.203 0.739 0.9845 1.0157 18 0.707 0.194 0.718 0.9854 1.0148 19 0.688 0.187 0.698 0.9862 1.0140 20 0.671 0.180 0.680 0.9869 1.0133 1.751 0.136 0.949 Factors for Control Limits . B4 B5 B 0 3.267 0 2.606 0 2.568 0 2.276 0 2.266 0 2.088 0 2.089 0 1.964 0.030 1.970 0.029 1.874 0.118 1.882 0.113 1.806 0.185 1.815 0.179 0.239 1.761 0.232 1.707 0.284 1.716 1.669 0.321 1.679 0.313 1.637 0.354 1.646 0.346 1.610 0.382 1.618 0.374 1.585 0.406 1.594 0.399 1.563 0.428 1.572 0.421 1.544 0.448 1.552 0.440 1.526 0.466 1.534 0.458 1.511 0.482 1.518 0.475 1.496 0.497 1.503 0.490 1.483 0.510 1.490 0.504 1.470 0.276 d2 1/d2 1.128 0.8865 1.693 0.5907 2.059 0.4857 2.326 0.4299 2.534 0.3946 2.704 0.3698 2.847 0.3512 2.970 0.3367 3.078 0.3249 3.173 0.3152 3.258 0.3069 3.336 0.2998 3.407 0.2935 3.472 0.2880 3.532 0.2831 3.588 0.2787 3.640 0.2747 3.689 0.2711 3.735 0.2677 Factors for Control Limits dz D. D2 D3 D4 0.853 0 3.686 0 3.267 0.888 0 4.358 0 2.574 0.880 0 4.698 0 2.282 0.864 0 4.918 0 2.114 0.848 0 5.078 0 2.004 0.833 0.204 5.204 0.076 1.924 0.820 0.388 5.306 1.864 0.808 0.547 5.393 0.184 1.816 0.797 0.687 5.469 0.223 1.777 0.787 0.811 5.535 0.256 1.744 0.778 0.922 5.594 0.283 1.717 0.770 1.025 5.647 0.307 1.693 0.763 1.118 5.696 0.328 1.672 0.756 1.203 5.741 0.347 1.653 0.750 1.282 5.782 0.363 1.637 0.744 1.356 5.820 0.378 1.622 0.739 1.424 5.856 0.391 1.608 0.734 1.487 5.891 0.403 1.597 1.549 5.921 0.415 1.585 0.729

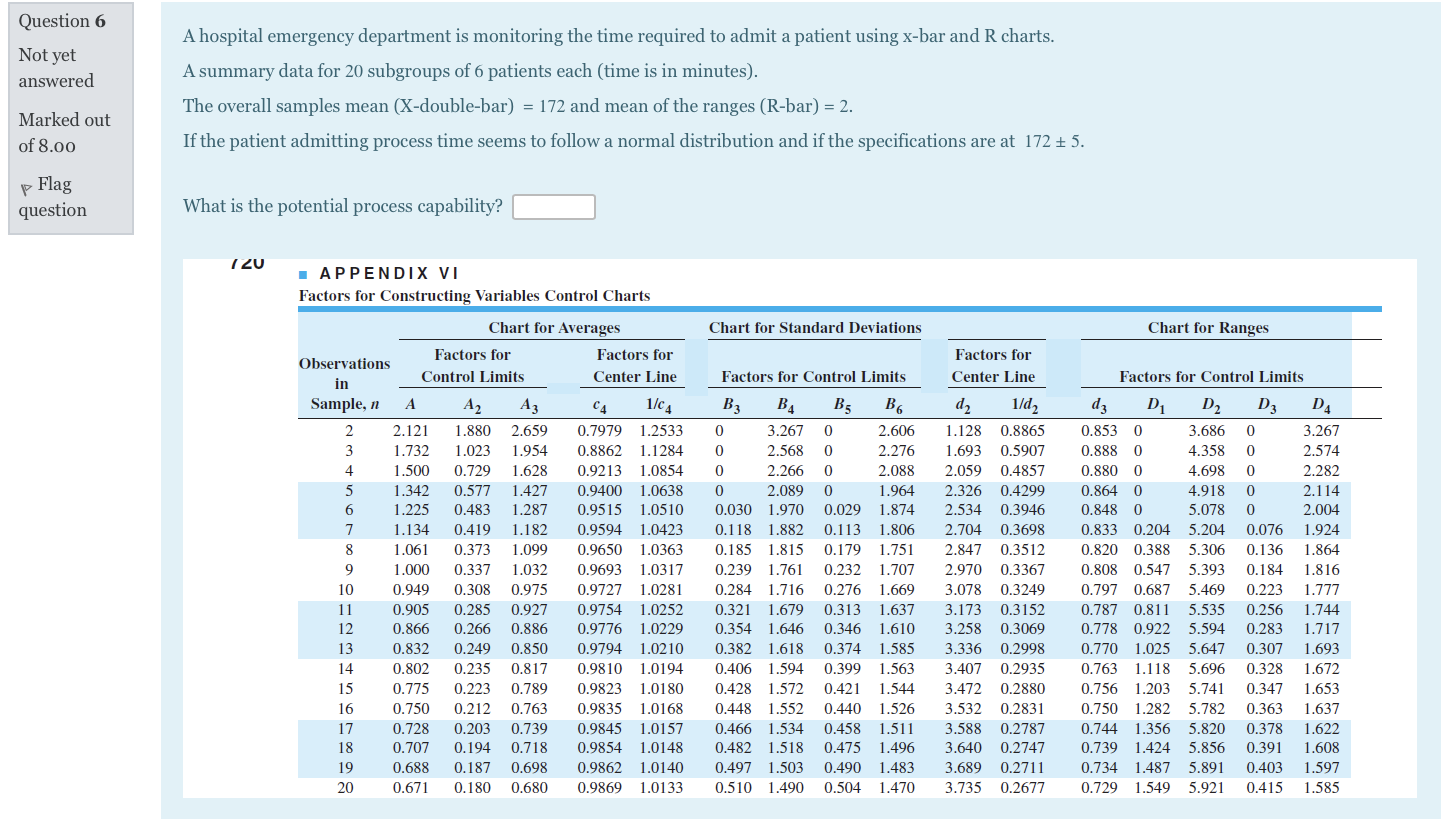
Step by Step Solution

There are 3 Steps involved in it

1 Expert Approved Answer
Step: 1 Unlock blur-text-image
Question Has Been Solved by an Expert!

Get step-by-step solutions from verified subject matter experts

Step: 2 Unlock
Step: 3 Unlock

Students Have Also Explored These Related General Management Questions!