

Question: Can you answer Demonstration 1 INTERACTIVE LECTURE DEMONSTRATIONS PREDICTION SHEET- SPECIFIC HEAT Directions: Write your name at the top to record your participation in these

Can you answer Demonstration 1
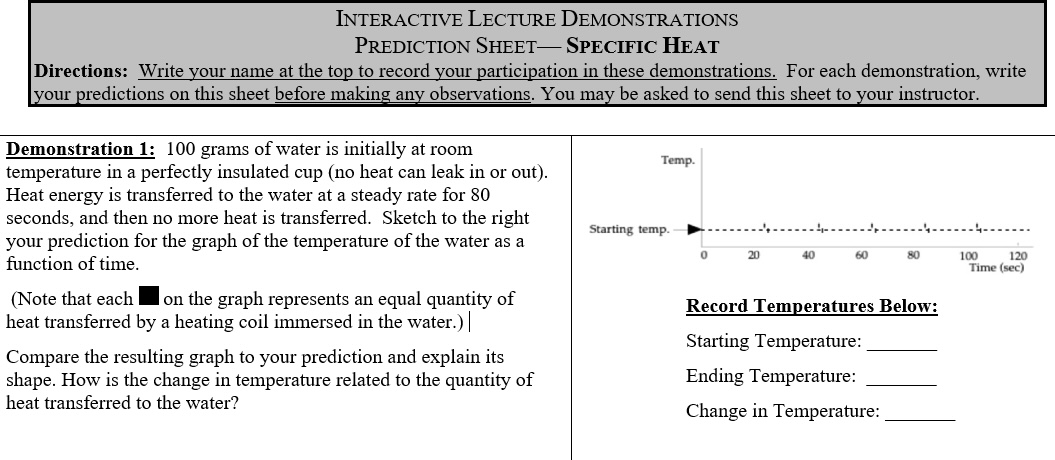

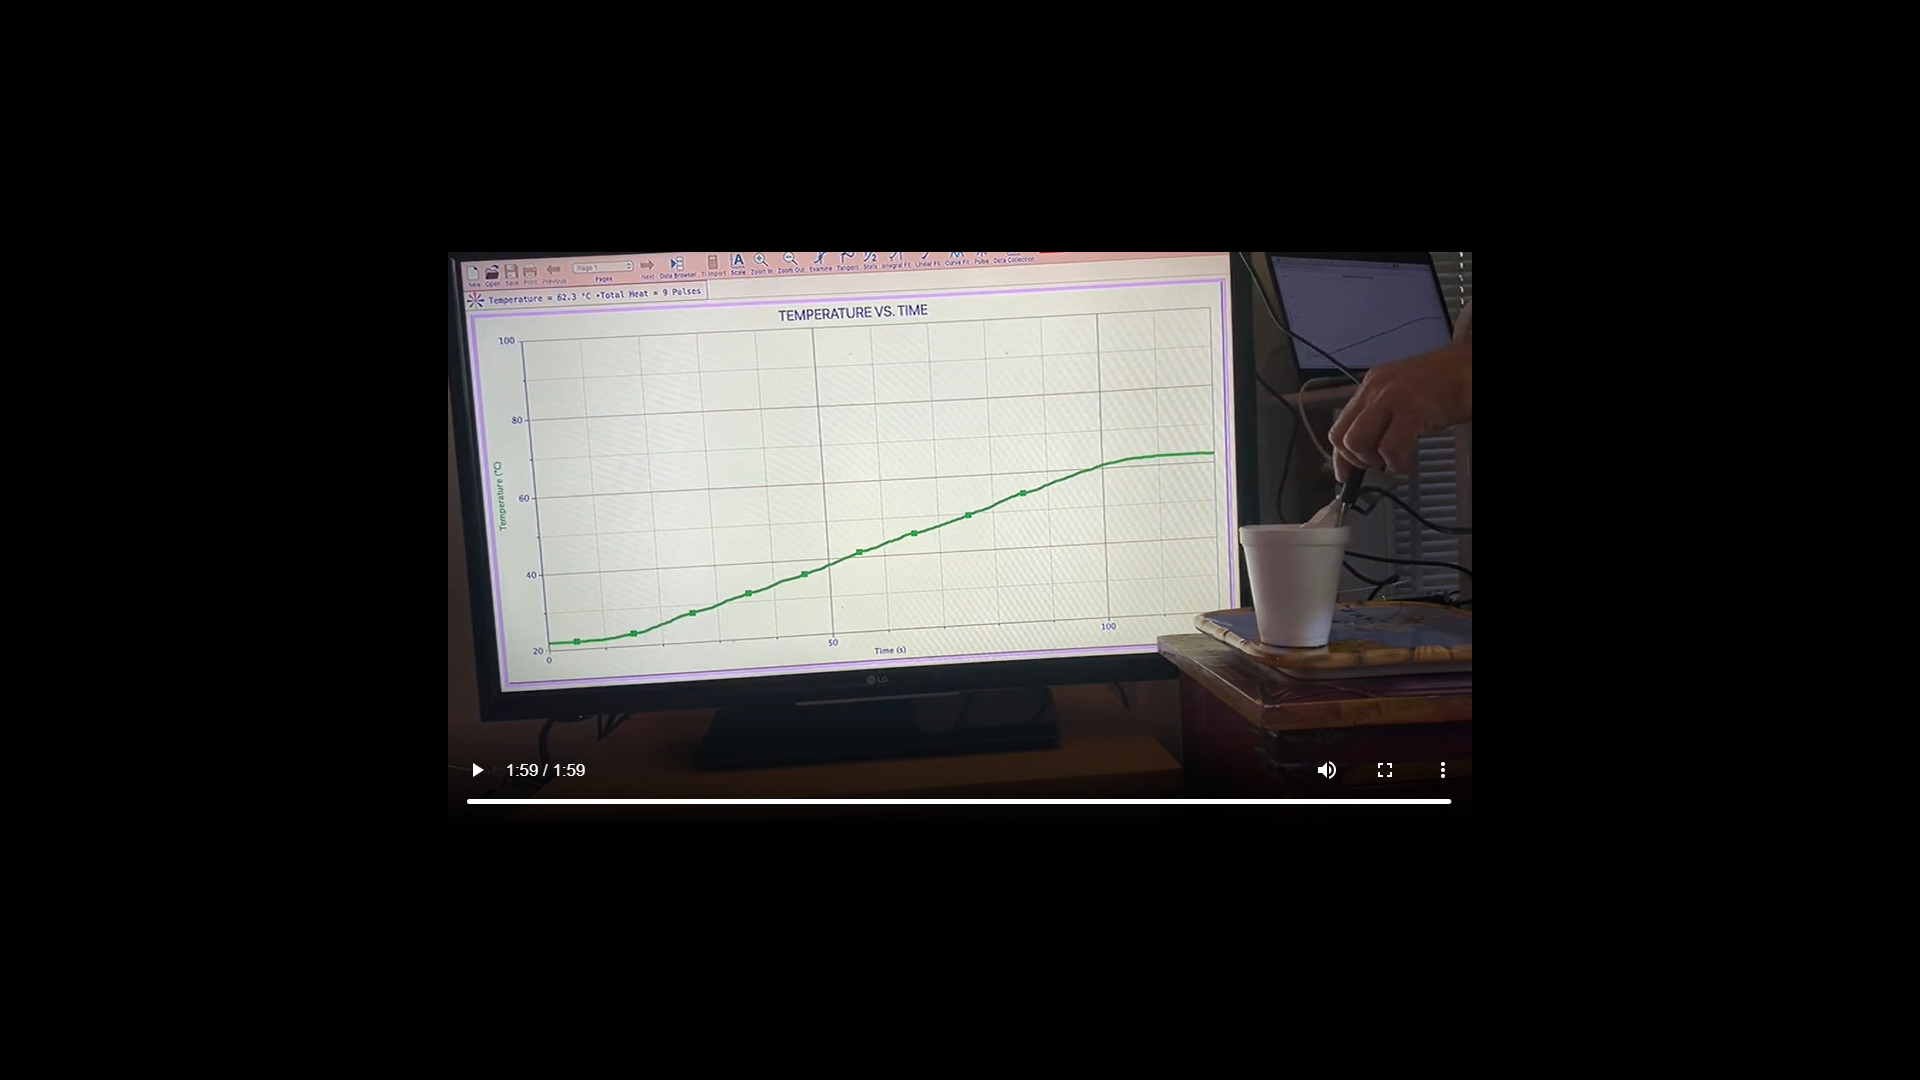
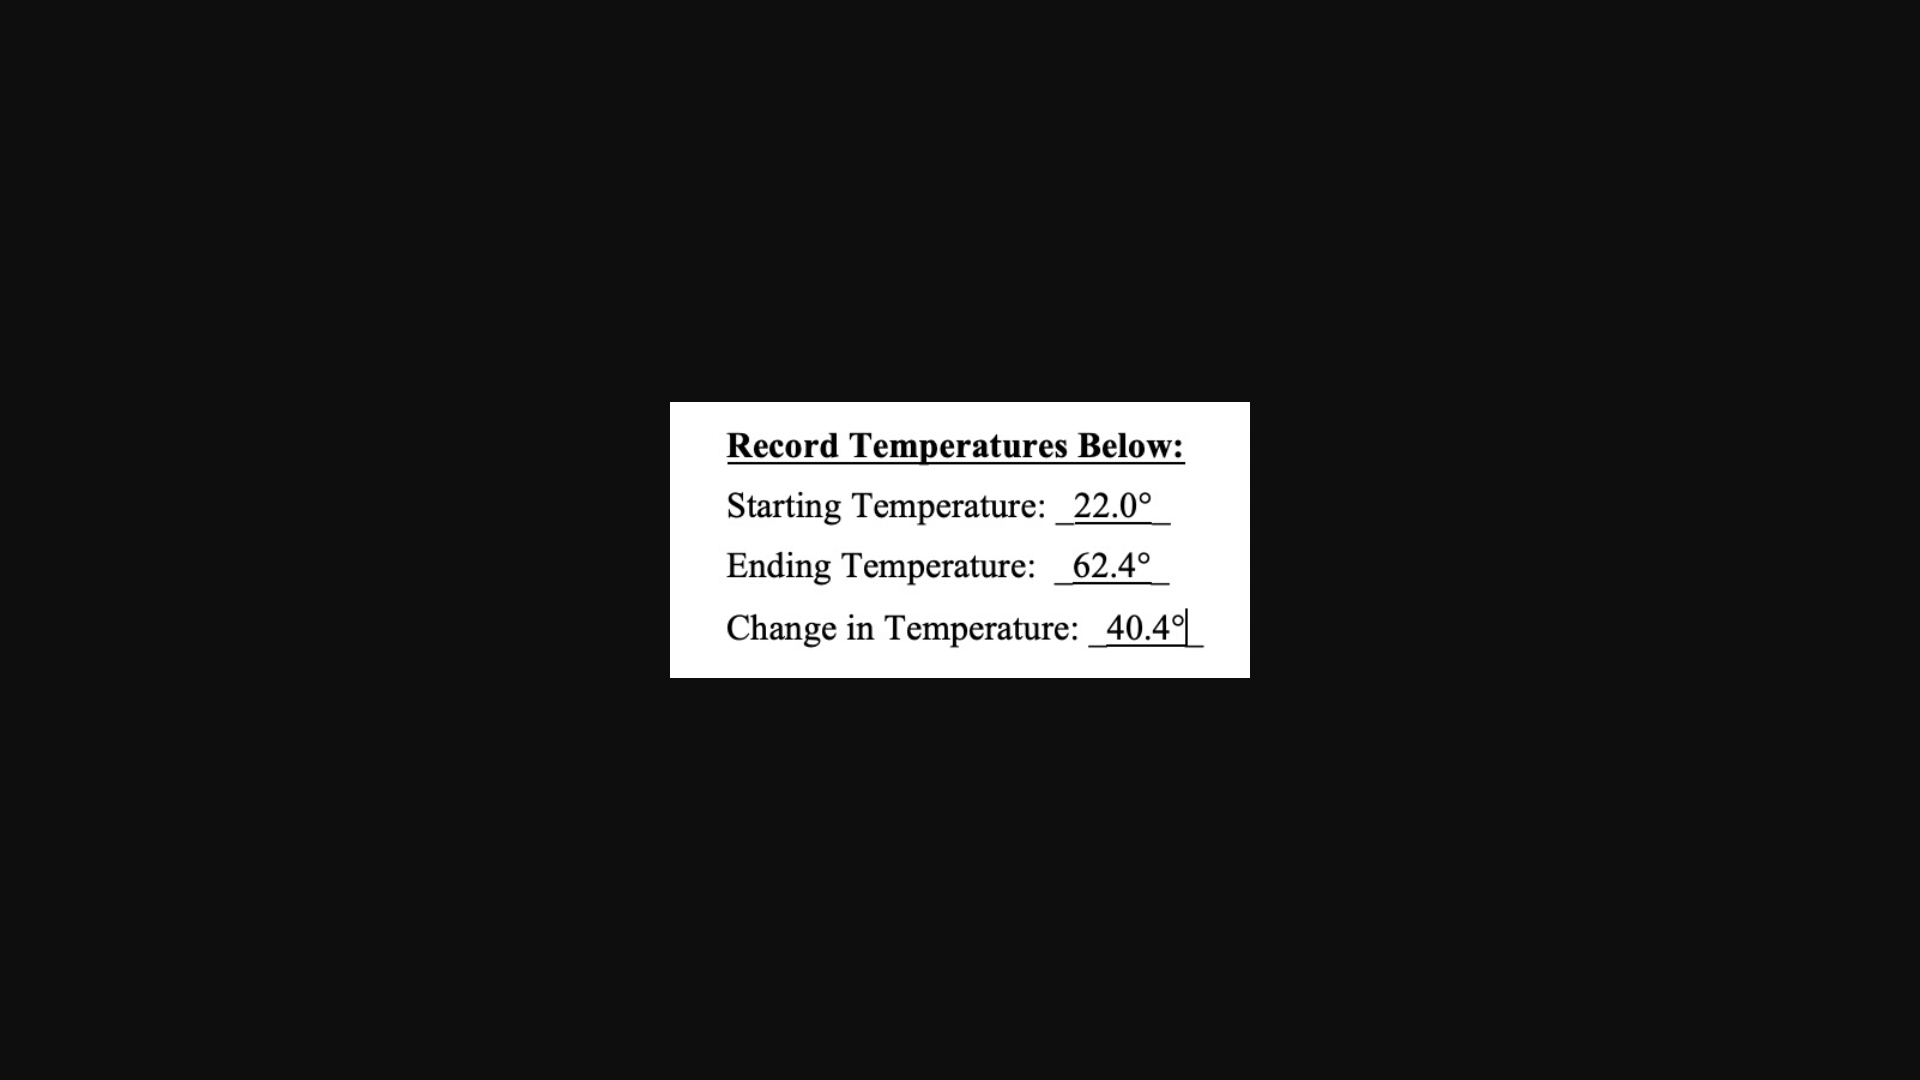
INTERACTIVE LECTURE DEMONSTRATIONS PREDICTION SHEET- SPECIFIC HEAT Directions: Write your name at the top to record your participation in these demonstrations. For each demonstration, write your predictions on this sheet before making any observations. You may be asked to send this sheet to your instructor. Demonstration 1: 100 grams of water is initially at room Temp. temperature in a perfectly insulated cup (no heat can leak in or out). Heat energy is transferred to the water at a steady rate for 80 seconds, and then no more heat is transferred. Sketch to the right Starting temp. your prediction for the graph of the temperature of the water as a function of time. 20 60 80 100 120 Time (sec) (Note that each on the graph represents an equal quantity of Record Temperatures Below: heat transferred by a heating coil immersed in the water.) Starting Temperature: Compare the resulting graph to your prediction and explain its shape. How is the change in temperature related to the quantity of Ending Temperature: heat transferred to the water? Change in Temperature:
Step by Step Solution
There are 3 Steps involved in it

Get step-by-step solutions from verified subject matter experts