

Question: can you d o this problem i n excel with formulas and can you show i t t o m e Problem 2 : Consider
can you this problem excel with formulas and can you show
Problem :
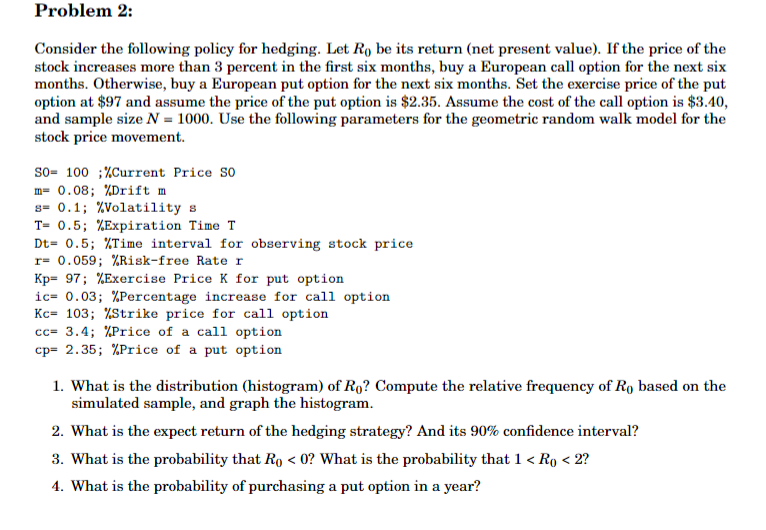
Consider the following policy for hedging. Let be its return net present value If the price of the
stock increases more than percent in the first six months, buy a European call option for the next six
months. Otherwise, buy a European put option for the next six months. Set the exercise price of the put
option at $ and assume the price of the put option is $ Assume the cost of the call option is $
and sample size Use the following parameters for the geometric random walk model for the
stock price movement.
S;Current Price S
m; Drift m
s; Volatility s
T; Expiration Time T
Dt; Time interval for observing stock price
Kp; Exercise Price K for put option
ic; Percentage increase for call option
Kc; Strike price for call option
cc; Price of a call option
cp; Price of a put option
What is the distribution histogram of Compute the relative frequency of based on the
simulated sample, and graph the histogram.
What is the expect return of the hedging strategy? And its confidence interval?
What is the probability that What is the probability that
What the probability purchasing a put option a year?
Step by Step Solution
There are 3 Steps involved in it
1 Expert Approved Answer
Step: 1 Unlock

Question Has Been Solved by an Expert!
Get step-by-step solutions from verified subject matter experts
Step: 2 Unlock
Step: 3 Unlock