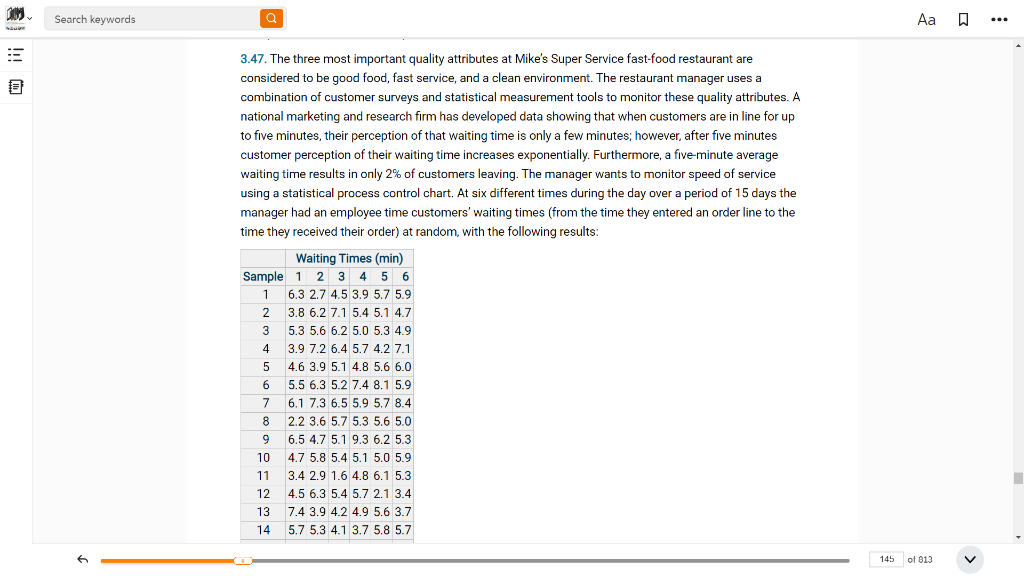
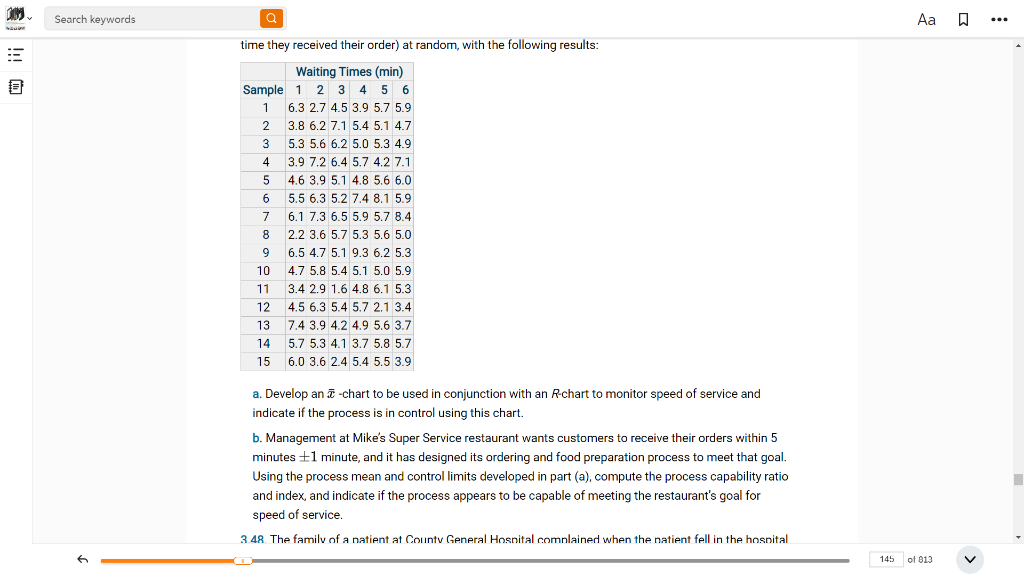
Question: can you do part A. Thanks with explaining and how you got the answer OW Search keywords ... 3.47. The three most important quality attributes

can you do part A. Thanks with explaining and howcan you do part A. Thanks with explaining and howcan you do part A. Thanks with explaining and how you got the answer

OW Search keywords ... 3.47. The three most important quality attributes at Mike's Super Service fast-food restaurant are considered to be good food, fast service, and a clean environment. The restaurant manager uses a combination of customer surveys and statistical measurement tools to monitor these quality attributes. A national marketing and research firm has developed data showing that when customers are in line for up to five minutes, their perception of that waiting time is only a few minutes; however, after five minutes customer perception of their waiting time increases exponentially. Furthermore, a five-minute average waiting time results in only 2% of customers leaving. The manager wants to monitor speed of service using a statistical process control chart. At six different times during the day over a period of 15 days the manager had an employee time customers' waiting times (from the time they entered an order line to the time they received their order) at random, with the following results: Waiting Times (min) Sample 1 2 3 4 5 6 1 6.3 2.7 4.5 3.9 5.7 5.9 2 3.8 6.2 7.1 5.4 5.1 4.7 3 5.3 5.6 6.2 5.0 5.3 4.9 4 3.9 7.2 6.4 5.7 4.2 7.1 5 4.6 3.9 5.1 4.8 5.6 6.0 6 5.5 6.3 5.2 7.4 8.1 5.9 7 6.1 7.3 6.5 5.9 5.7 8.4 8 2.2 3.6 5.7 5.3 5.6 5.0 9 6.5 4.7 5.1 9.3 6.2 5.3 10 4.7 5.8 5.4 5.1 5.0 5.9 11 3.4 2.9 1.6 4.8 6.1 5.3 12 4.5 6.3 5.4 5.7 2.1 3.4 13 7.4 3.9 4.2 4.9 5.6 3.7 14 5.7 5.3 4.1 3.7 5.8 5.7 T 145 of 013 OW Search keywords ... time they received their order) at random, with the following results: Waiting Times (min) Sample 1 2 3 4 5 6 1 6.3 2.7 4.5 3.9 5.7 5.9 2 3.8 6.2 7.1 5.4 5.1 4.7 3 5.3 5.6 6.2 5.0 5.3 4.9 4 3.9 7.2 6.4 5.7 4.2 7.1 5 4.6 3.9 5.1 4.8 5.6 6.0 6 5.5 6.3 5.2 7.4 8.1 5.9 7 6.1 7.3 6.5 5.9 5.7 8.4 8 2.2 3.6 5.7 5.3 5.6 5.0 9 6.5 4.7 5.1 9.3 6.2 5.3 10 4.7 5.8 5.4 5.1 5.0 5.9 11 3.4 2.9 1.6 4.8 6.1 5.3 12 4.5 6.3 5.4 5.7 2.1 3.4 13 7.4 3.9 4.2 4.9 5.6 3.7 14 5.7 5.3 4.1 3.7 5.8 5.7 15 6.0 3.6 2.4 5.4 5.5 3.9 a. Develop an T-chart to be used in conjunction with an R-chart to monitor speed of service and indicate if the process is in control using this chart. b. Management at Mike's Super Service restaurant wants customers to receive their orders within 5 minutes +1 minute, and it has designed its ordering and food preparation process to meet that goal. Using the process mean and control limits developed in part (a), compute the process capability ratio and index, and indicate if the process appears to be capable of meeting the restaurant's goal for speed of service 3.48. The family of a natient at County General Hospital complained when the natient fell in the hospital 145 of 013

Step by Step Solution

There are 3 Steps involved in it

1 Expert Approved Answer
Step: 1 Unlock blur-text-image
Question Has Been Solved by an Expert!

Get step-by-step solutions from verified subject matter experts

Step: 2 Unlock
Step: 3 Unlock

Students Have Also Explored These Related General Management Questions!