

Question: Can you explain and draw graphs? Will give a thumbs up! Thank you! 1) Consider the following model of trade between Iceland and Finland. Assume
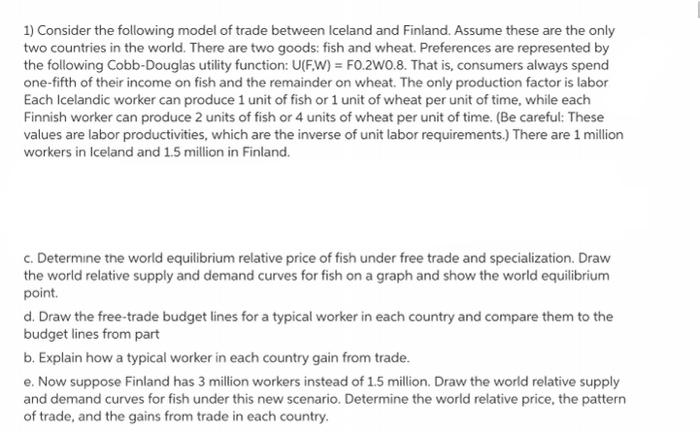
1) Consider the following model of trade between Iceland and Finland. Assume these are the only two countries in the world. There are two goods: fish and wheat. Preferences are represented by the following Cobb-Douglas utility function: U(FW) = FO.2W0.8. That is consumers always spend one-fifth of their income on fish and the remainder on wheat. The only production factor is labor Each Icelandic worker can produce 1 unit of fish or 1 unit of wheat per unit of time, while each Finnish worker can produce 2 units of fish or 4 units of wheat per unit of time. (Be careful: These values are labor productivities, which are the inverse of unit labor requirements. There are 1 million workers in Iceland and 1.5 million in Finland. c. Determine the world equilibrium relative price of fish under free trade and specialization. Draw the world relative supply and demand curves for fish on a graph and show the world equilibrium point d. Draw the free-trade budget lines for a typical worker in each country and compare them to the budget lines from part b. Explain how a typical worker in each country gain from trade. e. Now suppose Finland has 3 million workers instead of 1.5 million. Draw the world relative supply and demand curves for fish under this new scenario. Determine the world relative price, the pattern of trade, and the gains from trade in each country. 1) Consider the following model of trade between Iceland and Finland. Assume these are the only two countries in the world. There are two goods: fish and wheat. Preferences are represented by the following Cobb-Douglas utility function: U(FW) = FO.2W0.8. That is consumers always spend one-fifth of their income on fish and the remainder on wheat. The only production factor is labor Each Icelandic worker can produce 1 unit of fish or 1 unit of wheat per unit of time, while each Finnish worker can produce 2 units of fish or 4 units of wheat per unit of time. (Be careful: These values are labor productivities, which are the inverse of unit labor requirements. There are 1 million workers in Iceland and 1.5 million in Finland. c. Determine the world equilibrium relative price of fish under free trade and specialization. Draw the world relative supply and demand curves for fish on a graph and show the world equilibrium point d. Draw the free-trade budget lines for a typical worker in each country and compare them to the budget lines from part b. Explain how a typical worker in each country gain from trade. e. Now suppose Finland has 3 million workers instead of 1.5 million. Draw the world relative supply and demand curves for fish under this new scenario. Determine the world relative price, the pattern of trade, and the gains from trade in each country
Step by Step Solution
There are 3 Steps involved in it

Get step-by-step solutions from verified subject matter experts