

Question: Can you explain b) please and show the steps or formula on how to get the answer Consider the following sample. 23 45 24 35
Can you explain b) please and show the steps or formula on how to get the answer
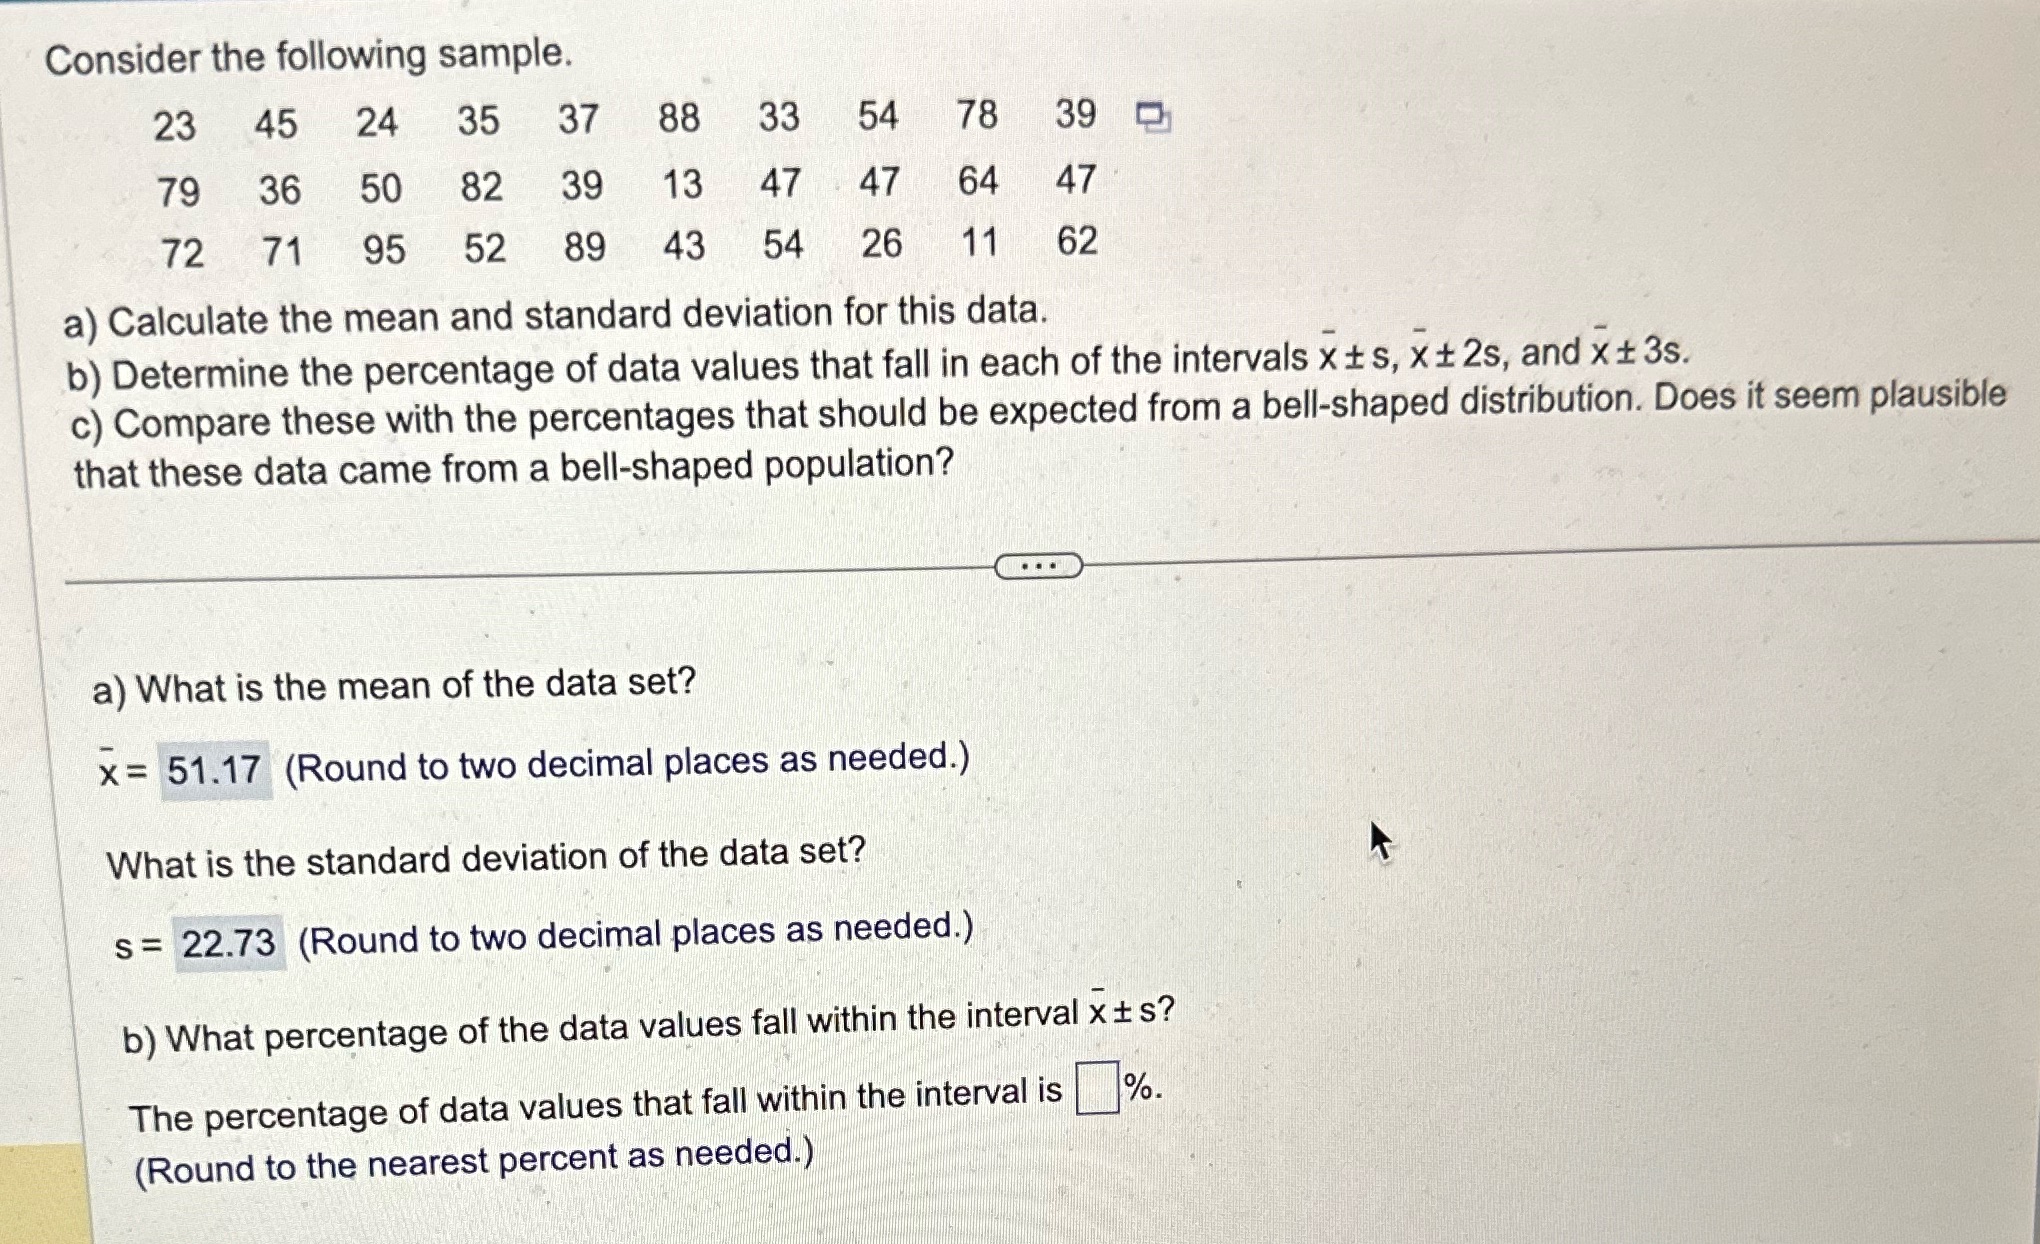
Consider the following sample. 23 45 24 35 37 88 33 54 78 39 D 79 36 50 82 39 13 47 47 64 47 72 71 95 52 89 43 54 26 11 62 3) Calculate the mean and standard deviation for this data. b) Determine the percentage of data values that fall in each of the intervals at t s, it 25, and ii 3s. c) Compare these with the percentages that should be expected from a bell-shaped distribution. Does it seem plausible that these data came from a bell-shaped population? w a) What is the mean of the data set? )1: 51.17 (Round to two decimal places as needed.) What is the standard deviation of the data set? k s = 22.73 (Round to two decimal places as needed.) e interval )1 :l: s? %. b) What percentage of the data values fall within th The percentage of data values that fall within the interval is [3 (Round to the nearest percent as needed.)
Step by Step Solution
There are 3 Steps involved in it

Get step-by-step solutions from verified subject matter experts