

Question: can you explain how did we solve this question? The following data apply to Problems 812. A pension fund manager is considering three mutual funds.
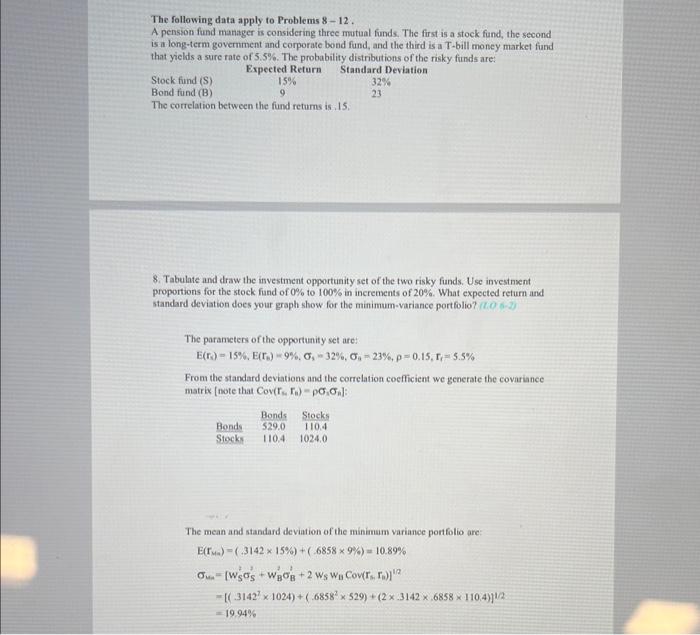
The following data apply to Problems 812. A pension fund manager is considering three mutual funds. The first is a stock fund, the second is a long-term government and corporate bond fund, and the third is a T-bill money market fund that yields a sure rate of 5.5%. The probability distributions of the risky funds are: Stock find (S) Expected Return Standard Deviation Bond fund (B) 15%932%23 The correlation between the fund retums is . 15 . 8. Tabulate and draw the investment opportunity set of the two risky funds. Use investnent proportions for the stock fund of 0% to 100% in increments of 20%. What expected return and standard deviation does your graph show for the minimum-variance portfolio? The parameters of the opportunity set are: E(ra)=15%,E(rb)=9%,s=32%,a=23%,=0.15,rq=5.5% From the standard deviations and the correlation coefficient we generate the covariance matrix [note that Cov(rmFn)=1n ]: The mean and standard deviation of the minimam variance portflio are: E(rMa)an=(.314215%)+(.68589%)=10.89%=[wS2S2+wB2B+2wSwBCov(rBrB)]1/2=[(.314271024)+(.68582529)+(21142.6858110.4)]1/2
Step by Step Solution
There are 3 Steps involved in it

Get step-by-step solutions from verified subject matter experts