

Can you explain how the yellow fields were calculated? Financial Plan Stock at Retail 01 02 03
Fantastic news! We've Found the answer you've been seeking!
Question:
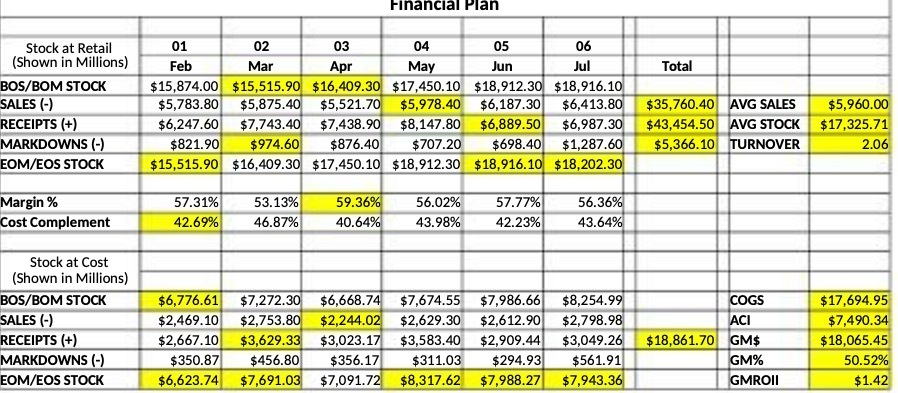
Can you explain how the yellow fields were calculated?
Expert Answer:

Related Book For 

Cost Management A Strategic Emphasis
ISBN: 978-0077733773
7th edition
Authors: Edward Blocher, David Stout, Paul Juras, Gary Cokins
Posted Date:
