

Question: Can you explain how to answer these? The summary statistics in Q1 shows that the average Covid19 infection rate in NYC is 2.93% with a
Can you explain how to answer these?
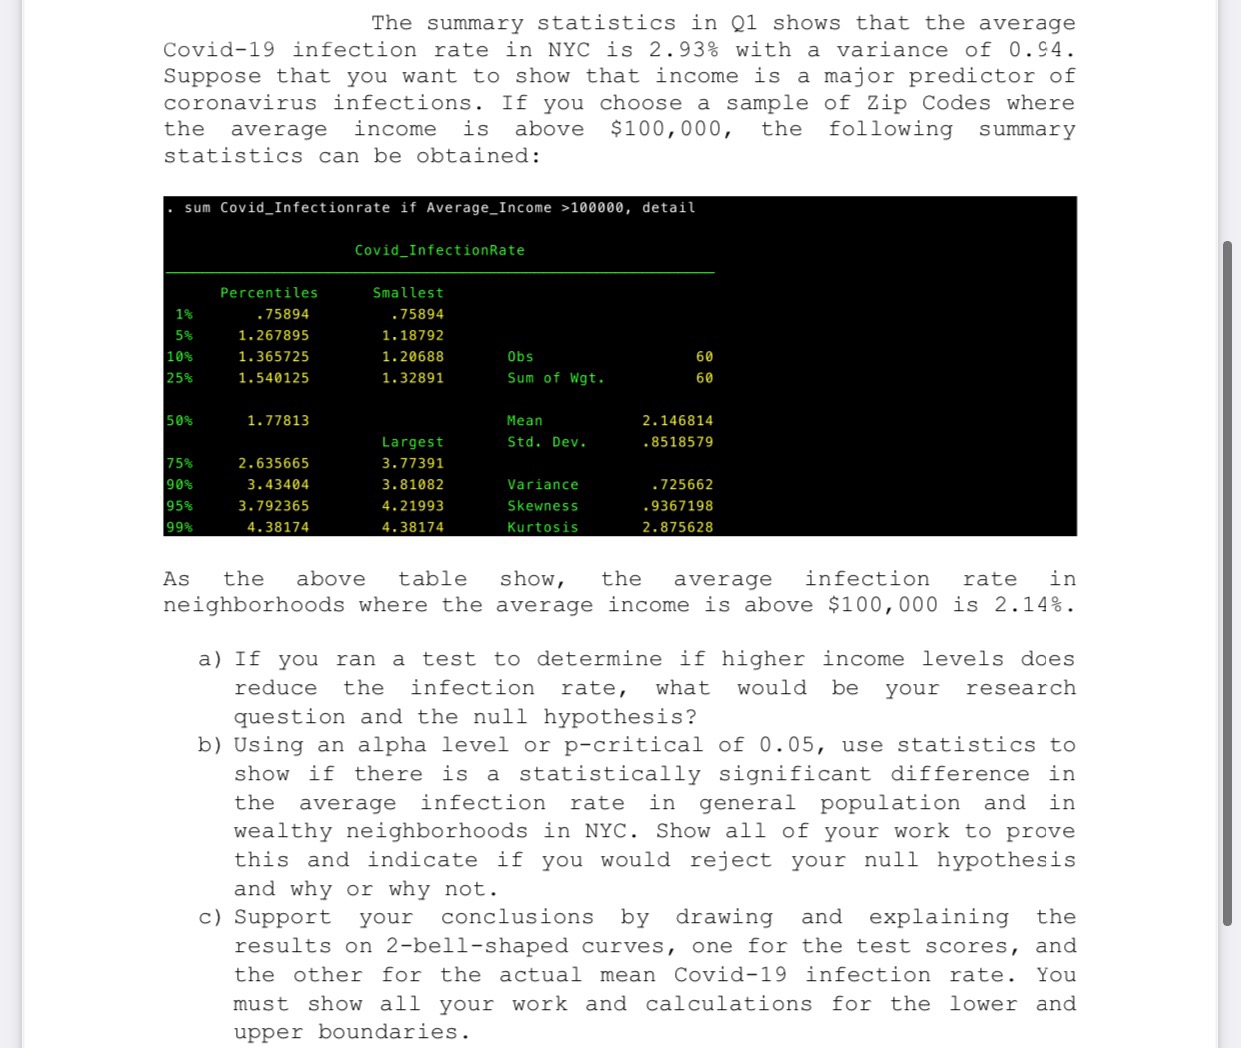
The summary statistics in Q1 shows that the average Covid19 infection rate in NYC is 2.93% with a variance of 0.94. Suppose that you want to show that income is a major predictor of coronavirus infections. If you choose a sample of Zip Codes where the average income is above $100,000, the following summary statistics can be obtained: As the above table show, the average infection rate in neighborhoods where the average income is above $100,000 is 2.14%. a)If you ran a test to determine if higher income levels does reduce the infection rate, what would be your research question and the null hypothesis? b) Using an alpha level or pcritical of 0.05, use statistics to show if there is a statistically significant difference in the average infection rate in general population and. in wealthy neighborhoods in NYC. Show all of your work to prove this and indicate if you would reject your null hypothesis and why or why not. c) Support your conclusions by drawing and explaining the results on Zwbellshaped curves, one for the test scores, and the other for the actual mean Covidl9 infection rate. You must show all your work and calculations for the lower and upper boundaries
Step by Step Solution
There are 3 Steps involved in it

Get step-by-step solutions from verified subject matter experts