

Question: Can you EXPLAIN me the formulas behind? Panel D: Computation of the Optimal Risky Portfolio DELL BP SHELL 0.0317 0.0297 S&P 500 Active Pf A
Can you EXPLAIN me the formulas behind?
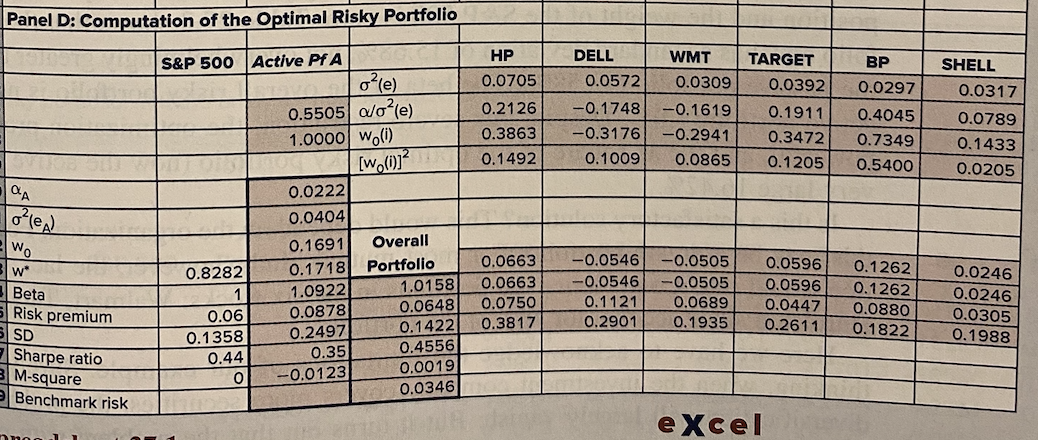
Panel D: Computation of the Optimal Risky Portfolio DELL BP SHELL 0.0317 0.0297 S&P 500 Active Pf A 0(e) 0.5505 /o?le) 1.0000 woll) HP 0.0705 0.2126 0.3863 0.1492 0.0572 -0.1748 -0.3176 0.1009 WMT 0.0309 --0.1619 -0.2941 0.0865 TARGET 0.0392 0.1911 0.3472 0.1205 0.4045 0.7349 0.5400 0.0789 0.1433 0.0205 [w.072 CA olex Wo w* Beta Risk premium SD Sharpe ratio 3 M-square Benchmark risk 0.8282 1 0.06 0.1358 0.44 0 0.0222 0.0404 0.1691 0.1718 1.0922 0.0878 0.2497 0.35 -0.0123 Overall Portfolio 1.0158 0.0648 0.1422 0.4556 0.0019 0.0346 0.0663 0.0663 0.0750 0.3817 -0.0546 -0.0546 0.1121 0.2901 -0.0505 -0.0505 0.0689 0.1935 0.0596 0.0596 0.0447 0.2611 0.1262 0.1262 0.0880 0.1822 0.0246 0.0246 0.0305 0.1988 excel nnan Panel D: Computation of the Optimal Risky Portfolio DELL BP SHELL 0.0317 0.0297 S&P 500 Active Pf A 0(e) 0.5505 /o?le) 1.0000 woll) HP 0.0705 0.2126 0.3863 0.1492 0.0572 -0.1748 -0.3176 0.1009 WMT 0.0309 --0.1619 -0.2941 0.0865 TARGET 0.0392 0.1911 0.3472 0.1205 0.4045 0.7349 0.5400 0.0789 0.1433 0.0205 [w.072 CA olex Wo w* Beta Risk premium SD Sharpe ratio 3 M-square Benchmark risk 0.8282 1 0.06 0.1358 0.44 0 0.0222 0.0404 0.1691 0.1718 1.0922 0.0878 0.2497 0.35 -0.0123 Overall Portfolio 1.0158 0.0648 0.1422 0.4556 0.0019 0.0346 0.0663 0.0663 0.0750 0.3817 -0.0546 -0.0546 0.1121 0.2901 -0.0505 -0.0505 0.0689 0.1935 0.0596 0.0596 0.0447 0.2611 0.1262 0.1262 0.0880 0.1822 0.0246 0.0246 0.0305 0.1988 excel nnan
Step by Step Solution
There are 3 Steps involved in it

Get step-by-step solutions from verified subject matter experts