

Question: Can you explain step by step and give an example in question #6,7, and 14. Thanks CSuppose a geyser has a mean time between eruptions
Can you explain step by step and give an example in question #6,7, and 14. Thanks
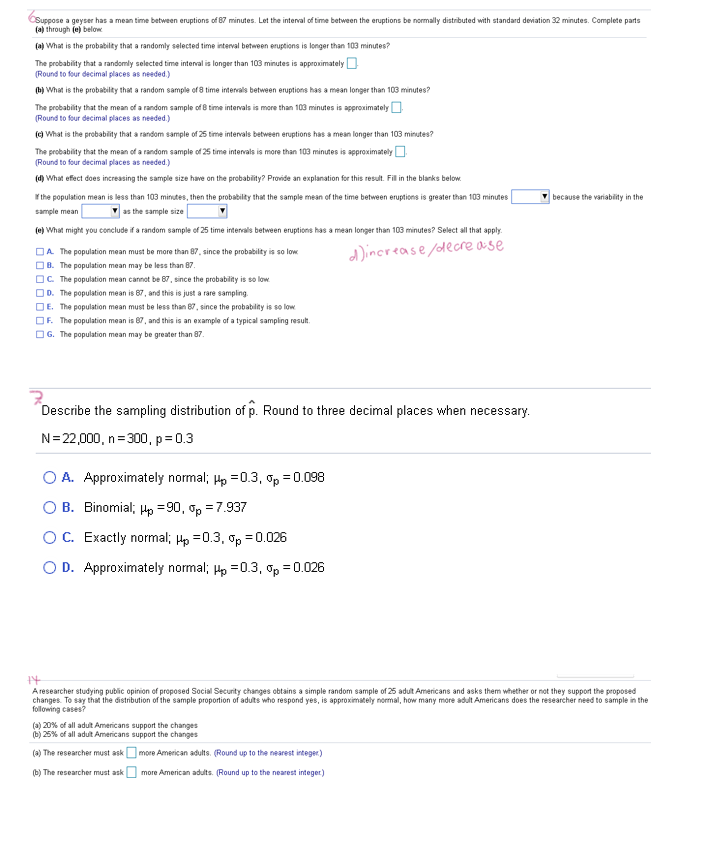
CSuppose a geyser has a mean time between eruptions of 87 minutes. Let the interval of time between the eruptions be normally distributed with standard deviation 32 minutes. Complete parts (a) through (e) below Cap What is the probability that a randomly selected time interval between eruptions is longer than 109 minutes? The probability that a randomly selected time interval is longer than 103 minutes is approximately Round to four decimal places as needed.) by What is the probability that a random sample of 8 time intervals between eruptions has a mean longer than 103 minutes? The probability that the mean of a random sample of @ time intervals is more than 103 minutes is approximately (Round to four decimal places as needed.) [e) What is the probability that a random sample of 25 time intervals between eruptions has a mean longer than 103 minutes? The probability that the mean of a random sample of 25 time intervals is more than 103 minutes is approximately(]. (Round to four decimal places as needed.) (d) What effect does increasing the sample size have on the probability? Provide an explanation for this result. Fill in the blanks below. the population mean is less than 103 minutes, then the probability that the sample mean of the time between eruptions is greater than 103 minutes because the variability in the sample mean as the sample size Tel What might you conclude if a random sample of 25 time intervals between eruptions has a mean longer than 103 minutes? Select all that apply. A. The population mean must be more than U.. since the probability is so low d )increase/ decrease B. The population mean may be less than 87. OC. The population mean cannot be 87, since the probability is so low OD. The population mean is 87, and this is just a rare sampling. DE. The population mean must be less than 87, since the probability is so low OF. The population mean is 87, and this is an example of a typical sampling result. G. The population mean may be greater than 87. Describe the sampling distribution of p. Round to three decimal places when necessary. N =22,000, n =300, p =0.3 O A. Approximately normal; Up =0.3, Up =0.098 O B. Binomial; Hp =90, Up =7.937 O C. Exactly normal; Hp = 0.3, Up =0.026 O D. Approximately normal; Up =0.3, Op = 0.026 A researcher studying public opinion of proposed Social Security changes obtains a simple random sample of 25 adult Americans and asks them whether or not they support the proposed following cases? changes. To say that the distribution of the sample proportion of adults who respond yes, is approximately normal, how many more adult Americans does the researcher need to sample in the (a) 20%% of all adult Americans support the changes (b) 25% of all adult Americans support the changes (a) The researcher must ask | |more American adults. (Round up to the nearest integer) (b) The researcher must ask (more American adults. (Round up to the nearest integer)
Step by Step Solution
There are 3 Steps involved in it

Get step-by-step solutions from verified subject matter experts