

Question: Can you explain the steps not just an answer The following the shows the actual demand obwrved over the last 10 years Year Demand 2010
Can you explain the steps not just an answer 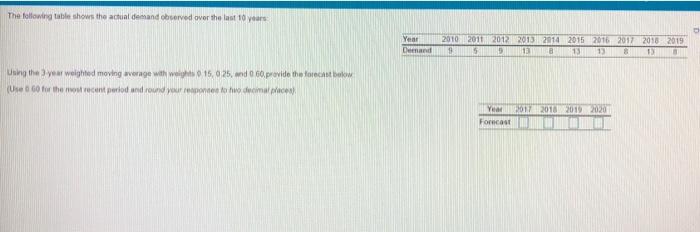
The following the shows the actual demand obwrved over the last 10 years Year Demand 2010 2011 2012 2013 2014 2015 2016 2017 2018 2019 5. 5 13 8 15 13 using the year weighted moving average with 15.025, and o 60 provide the forecast below (Us Go for the most recent period and round your own to ho duomet pace Year 2017 2018 2019 2020 Foreca | MEU
Step by Step Solution
There are 3 Steps involved in it
1 Expert Approved Answer
Step: 1 Unlock

Question Has Been Solved by an Expert!
Get step-by-step solutions from verified subject matter experts
Step: 2 Unlock
Step: 3 Unlock