

Question: Can you explain these and please give an example for good understanding. The graph of the discrete probability to the right represents the number of
Can you explain these and please give an example for good understanding.
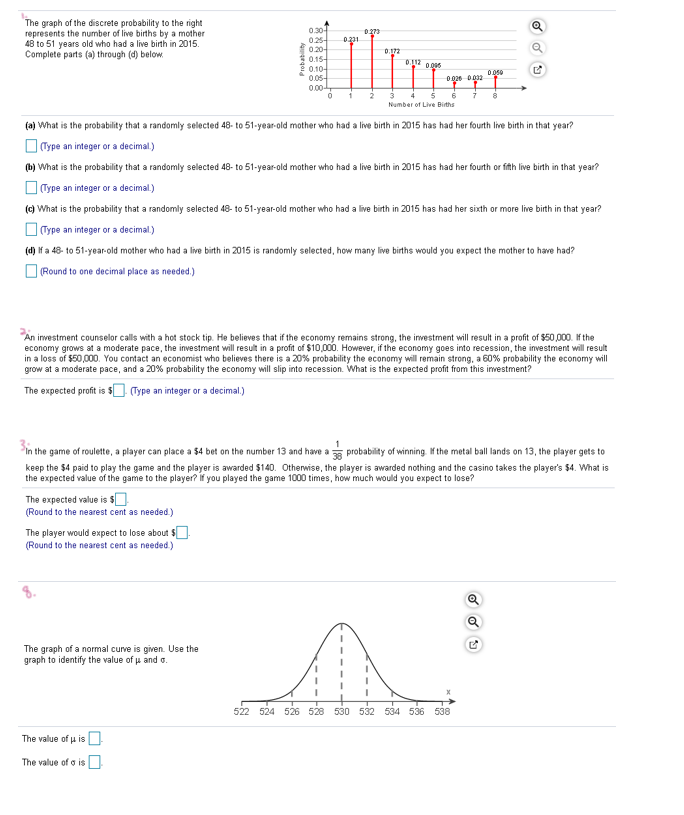
The graph of the discrete probability to the right represents the number of live births by a mother 0.30- 0 273 48 to 51 years old who had a live birth in 2015. 0 231 Complete parts (a) through (d) below #0.20- 0.15- 2 0.10- 0.1 12 0.986 0.05- 5 Number of Live Births (a) What is the probability that a randomly selected 48- to 51-year-old mother who had a live birth in 2015 has had her fourth live birth in that year? (Type an integer or a decimal.) (b) What is the probability that a randomly selected 48- to 51-year-old mother who had a live birth in 2015 has had her fourth or fifth live birth in that year? (Type an integer or a decimal) (c) What is the probability that a randomly selected 48- to 51-year-old mother who had a live birth in 2015 has had her sixth or more live birth in that year? (Type an integer or a decimal ) (d) If a 48- to 51-year-old mother who had a live birth in 2015 is randomly selected, how many live births would you expect the mother to have had? (Round to one decimal place as needed.) An investment counselor calls with a hot stock tip. He believes that if the economy remains strong, the investment will result in a profit of $50,000. If the economy grows at a moderate pace, the investment will result in a profit of $10,000. However, if the economy goes into recession, the investment will result in a loss of $50,000. You contact an economist who believes there is a 20% probability the economy will remain strong, a 60% probability the economy will grow at a moderate pace, and a 20% probability the economy will slip into recession. What is the expected profit from this investment? The expected profit is $ . (Type an integer or a decimal.) In the game of roulette, a player can place a $4 bet on the number 13 and have a 5 probability of winning If the metal ball lands on 13, the player gets to keep the $4 paid to play the game and the player is awarded $140. Otherwise, the player is awarded nothing and the casino takes the player's $4. What is the expected value of the game to the player? If you played the game 1000 times, how much would you expect to lose? The expected value is $ Round to the nearest cent as needed) The player would expect to lose about $]. (Round to the nearest cent as needed) The graph of a normal curve is given. Use the graph to identify the value of us and q. 522 524 526 528 530 532 534 536 538 The value of p is The value of o is
Step by Step Solution
There are 3 Steps involved in it

Get step-by-step solutions from verified subject matter experts