

Question: Can you explain to me what analyses and interpretations are possible based on the figures of attached SPSS tables? I would like to know what
Can you explain to me what analyses and interpretations are possible based on the figures of attached SPSS tables? I would like to know what figures on the table mean.
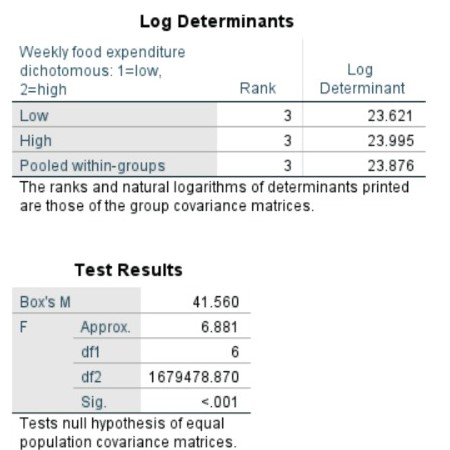
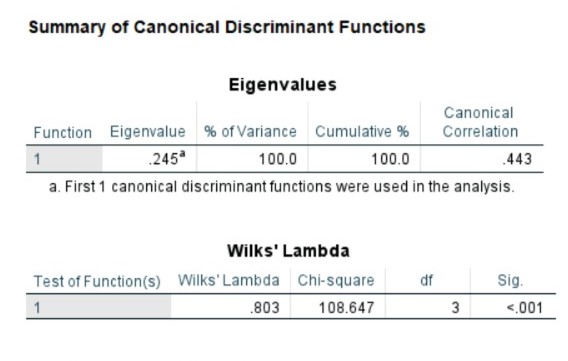
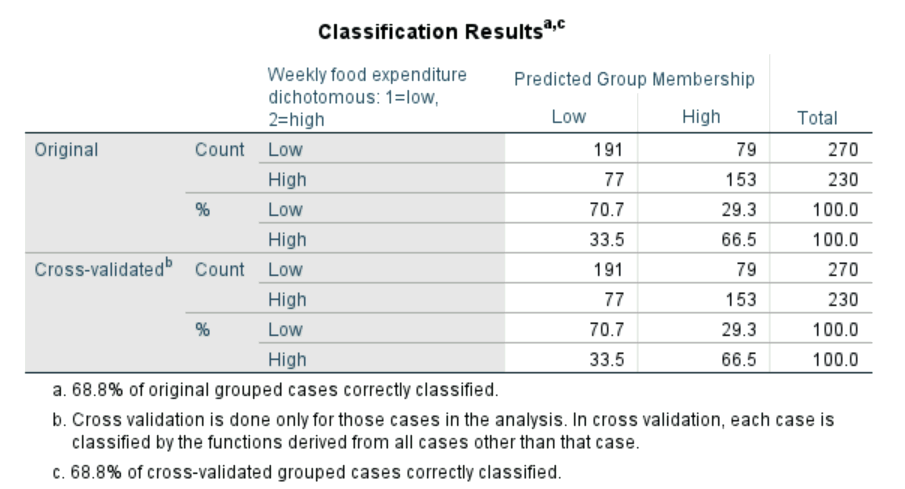
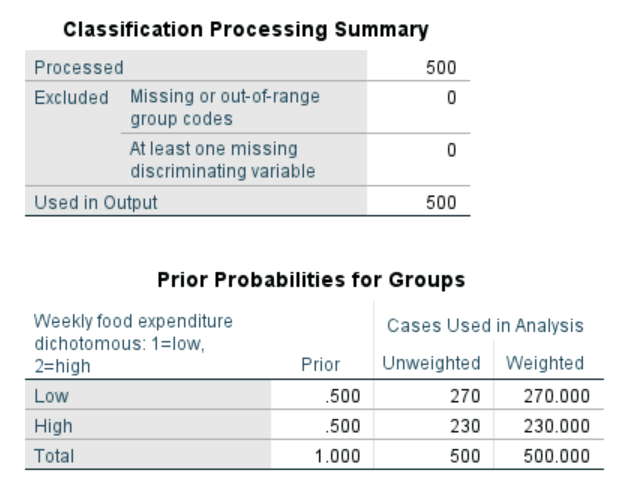
Instructions: Determine which of the independent variables at a scale measurement level in the database discriminates the probability that a home is a "low consumption household" or a "high consumption household." Carry out a full interpretation of the discriminant analysis as was done in class.
- Y: Food expenditure (low vs high)
- X1: Number (specific amount) of people in the family
- X2: Annual income ($) of the family in monetary units per household
- X3: Current age of the head of the family in completed years
Step by Step Solution
There are 3 Steps involved in it
1 Expert Approved Answer
Step: 1 Unlock

Question Has Been Solved by an Expert!
Get step-by-step solutions from verified subject matter experts
Step: 2 Unlock
Step: 3 Unlock