

Question: Can you find the correct answer for this problem. See attachment Given sample charts showing management reserve (MR) usage, interpret the chart. Question 3 of
Can you find the correct answer for this problem. See attachment
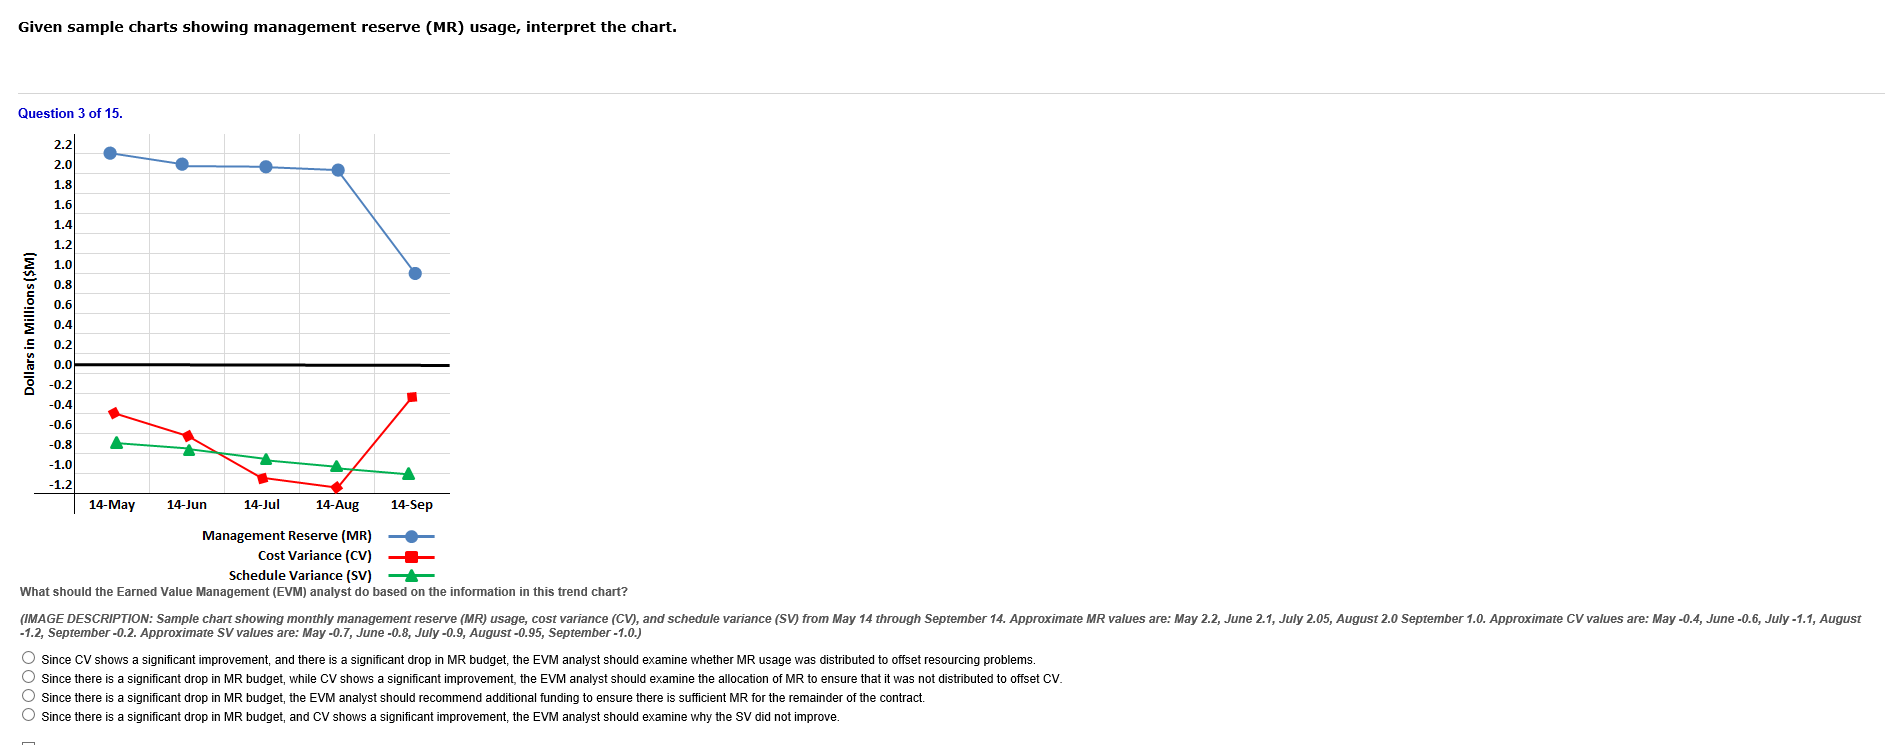
Given sample charts showing management reserve (MR) usage, interpret the chart. Question 3 of 15. 2.2 2.0 1.8 1.6 1.4 Dollars in Millions ($M) -0.2 0.4 0.6 -0.8 1.0 1.2 14-May 14-Jun 14-Jul 14-Aug 14-Sep Management Reserve (MR) Cost Variance (CV) Schedule Variance (SV) What should the Earned Value Management (EVM) analyst do based on the information in this trend chart? (IMAGE DESCRIPTION: Sample chart showing monthly management reserve (MR) usage, cost variance (CV), and schedule variance (SV) from May 14 through September 14. Approximate MR values are: May 2.2, June 2.1, July 2.05, August 2.0 September 1.0. Approximate CV values are: May -0.4, June -0.6, July -1.1, August -1.2, September -0.2. Approximate SV values are: May -0.7, June -0.8, July -0.9, August -0.95, September -1.0.) Since CV shows a significant improvement, and there is a significant drop in MR budget, the EVM analyst should examine whether MR usage was distributed to offset resourcing problems. Since there is a significant drop in MR budget, while CV shows a significant improvement, the EVM analyst should examine the allocation of MR to ensure that it was not distributed to offset CV. Since there is a significant drop in MR budget, the EVM analyst should recommend additional funding to ensure there is sufficient MR for the remainder of the contract. Since there is a significant drop in MR budget, and CV shows a significant improvement, the EVM analyst should examine why the SV did not improve
Step by Step Solution
There are 3 Steps involved in it

Get step-by-step solutions from verified subject matter experts