

Question: Can you hand draw the scatter plot ? NAME Can a cat's percent body fat be used to predict its takeoff velocity when jumping? The
Can you hand draw the scatter plot ? 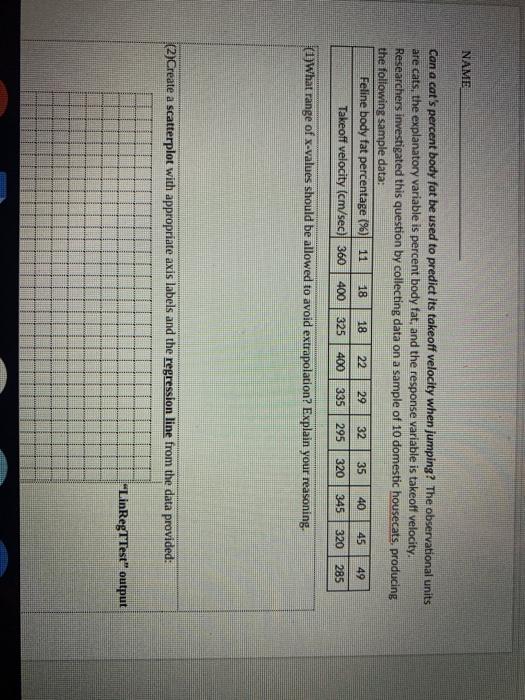


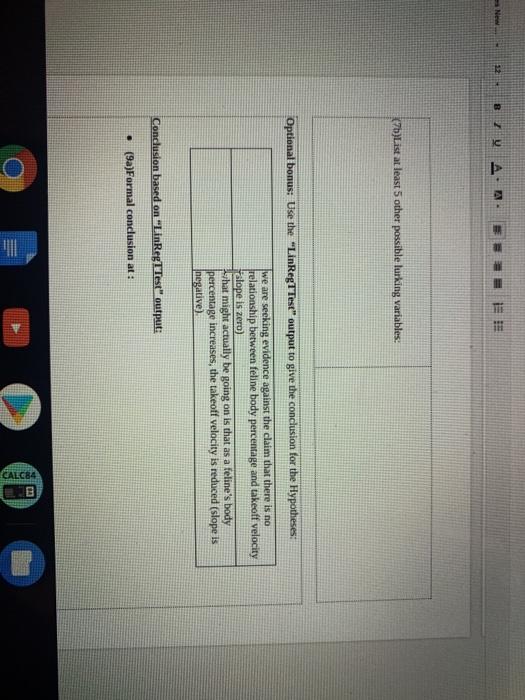
NAME Can a cat's percent body fat be used to predict its takeoff velocity when jumping? The observational units are cats, the explanatory variable is percent body fat, and the response variable is takeoff velocity. Researchers investigated this question by collecting data on a sample of 10 domestic housecats, producing the following sample data: Feline body fat percentage (%) 11 18 18 22 29 32 35 40 45 49 Takeoff velocity (cm/sec) 360 400 325 400 335 295 320 345 320 285 (1) What range of x-values should be allowed to avoid extrapolation? Explain your reasoning. (2)Create a scatterplot with appropriate axis labels and the regression line from the data provided: "LinRegTTest" output y A (2)Create a scatterplot with appropriate axis labels and the regression line from the data provided: "LinRegt Test" output I B) Write de equation of the regression line in standard linear forme (4) Create a table of values with at least 3 coordinates to assist you in 3) Write the equation of the regression line in standard linear form: (4)Create a table of values with at least coordinates to assist you in graphing your regression line I docx e New 12 B ZU A A We equation of the pression live land formeable on Wiscoedino in graphing your line I Check this box when you have added the regression line I to your scatterplot: "feline body fat% vs Takeoff velocity" scenario continued... (5)Give the value of the correlation coefficient and (6)Give the value of the slope and write a sentence write a sentence interpreting this value in the context. interpreting this value in the context (7a)Give the value of and write a sentence interpreting (8)Use your model to predict the takeoff velocity for this value in the context. a feline who has a body fat percentage of 22%. Show your algebra steps. I New 11 8 TA (75)List at least 5 other possible lurking variables: Optional bonus: Use the "LinReg TTest" output to give the conclusion for the Hypotheses: we are seeking evidence against the claim that there is no relationship between feline body percentage and takeoff velocity Halope is zero) what might actually be going on is that as a feline's body percentage increases, the takeoff velocity is reduced (slope is negative) Conclusion based on "LinRegt Test" output: . (9a)Formal conclusion at: om CALCBA we are seeking evidence against the claim that there is no relationship between feline body percentage and takeoff velocity (slope is zero) what might actually be going on is that as a feline body percentage increases, the takeoff velocity is reduced (slope is negative) Conclusion based on "LinRegTTest" output: . (9a)Formal conclusion at: (9b)Interpretation: I CALC84 NAME Can a cat's percent body fat be used to predict its takeoff velocity when jumping? The observational units are cats, the explanatory variable is percent body fat, and the response variable is takeoff velocity. Researchers investigated this question by collecting data on a sample of 10 domestic housecats, producing the following sample data: Feline body fat percentage (%) 11 18 18 22 29 32 35 40 45 49 Takeoff velocity (cm/sec) 360 400 325 400 335 295 320 345 320 285 (1) What range of x-values should be allowed to avoid extrapolation? Explain your reasoning. (2)Create a scatterplot with appropriate axis labels and the regression line from the data provided: "LinRegTTest" output y A (2)Create a scatterplot with appropriate axis labels and the regression line from the data provided: "LinRegt Test" output I B) Write de equation of the regression line in standard linear forme (4) Create a table of values with at least 3 coordinates to assist you in 3) Write the equation of the regression line in standard linear form: (4)Create a table of values with at least coordinates to assist you in graphing your regression line I docx e New 12 B ZU A A We equation of the pression live land formeable on Wiscoedino in graphing your line I Check this box when you have added the regression line I to your scatterplot: "feline body fat% vs Takeoff velocity" scenario continued... (5)Give the value of the correlation coefficient and (6)Give the value of the slope and write a sentence write a sentence interpreting this value in the context. interpreting this value in the context (7a)Give the value of and write a sentence interpreting (8)Use your model to predict the takeoff velocity for this value in the context. a feline who has a body fat percentage of 22%. Show your algebra steps. I New 11 8 TA (75)List at least 5 other possible lurking variables: Optional bonus: Use the "LinReg TTest" output to give the conclusion for the Hypotheses: we are seeking evidence against the claim that there is no relationship between feline body percentage and takeoff velocity Halope is zero) what might actually be going on is that as a feline's body percentage increases, the takeoff velocity is reduced (slope is negative) Conclusion based on "LinRegt Test" output: . (9a)Formal conclusion at: om CALCBA we are seeking evidence against the claim that there is no relationship between feline body percentage and takeoff velocity (slope is zero) what might actually be going on is that as a feline body percentage increases, the takeoff velocity is reduced (slope is negative) Conclusion based on "LinRegTTest" output: . (9a)Formal conclusion at: (9b)Interpretation: I CALC84 Step by Step Solution
There are 3 Steps involved in it
1 Expert Approved Answer
Step: 1 Unlock

Question Has Been Solved by an Expert!
Get step-by-step solutions from verified subject matter experts
Step: 2 Unlock
Step: 3 Unlock