

Question: Can you help me answer the 3 question listed on the listed on the page Improving a company's operations and supply chain is an ongoing
Can you help me answer the 3 question listed on the listed on the page
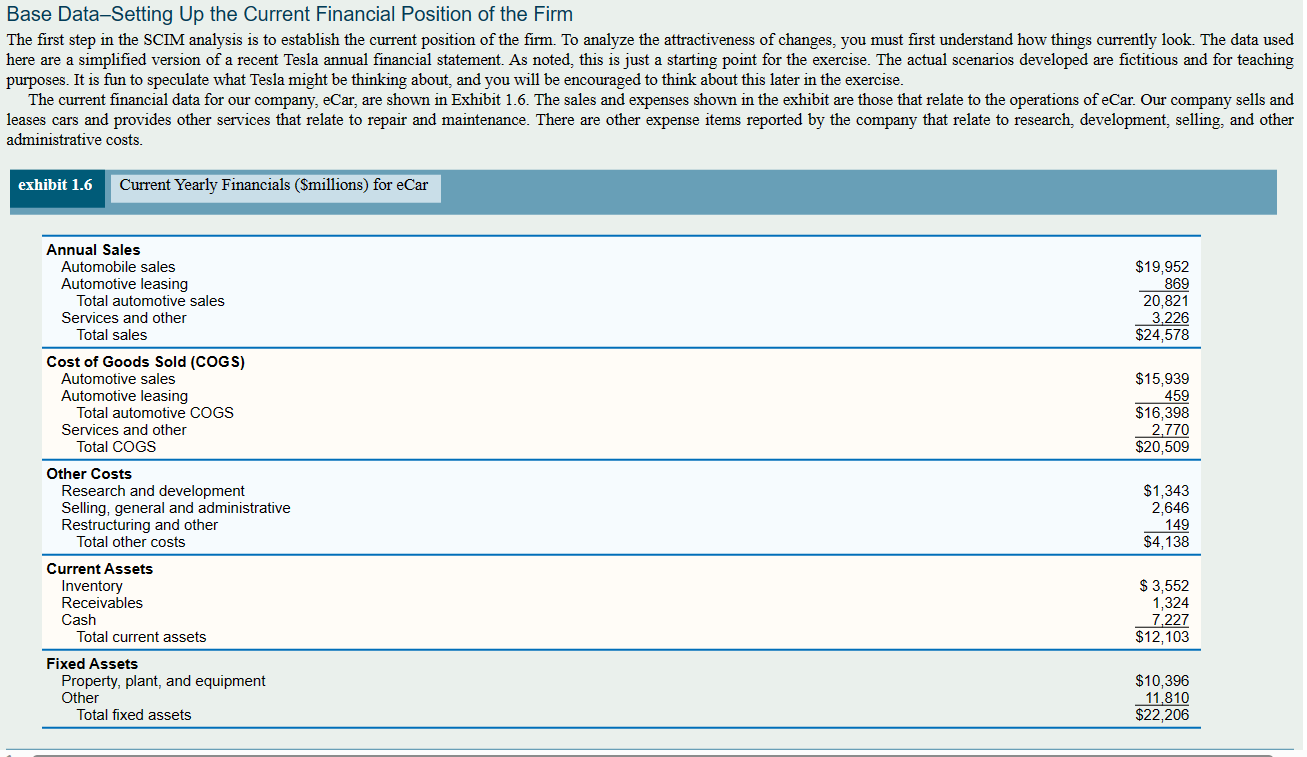
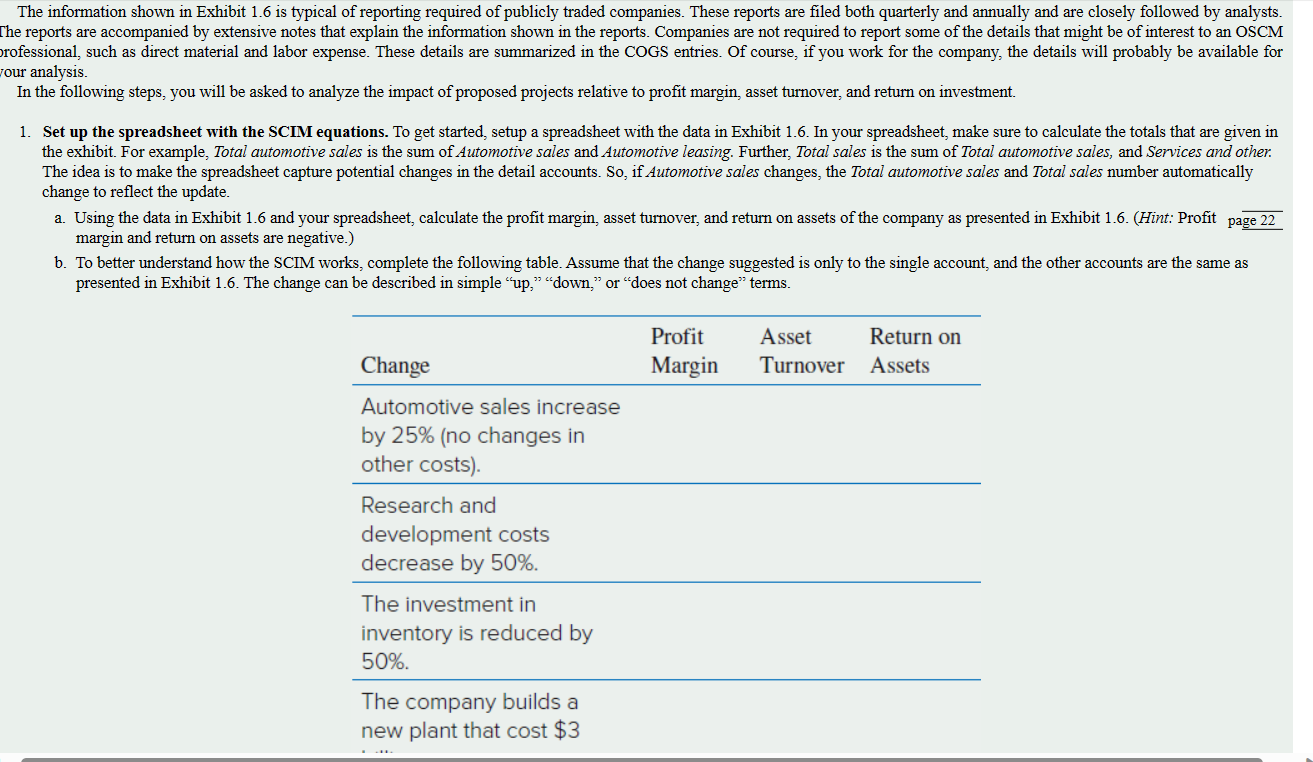
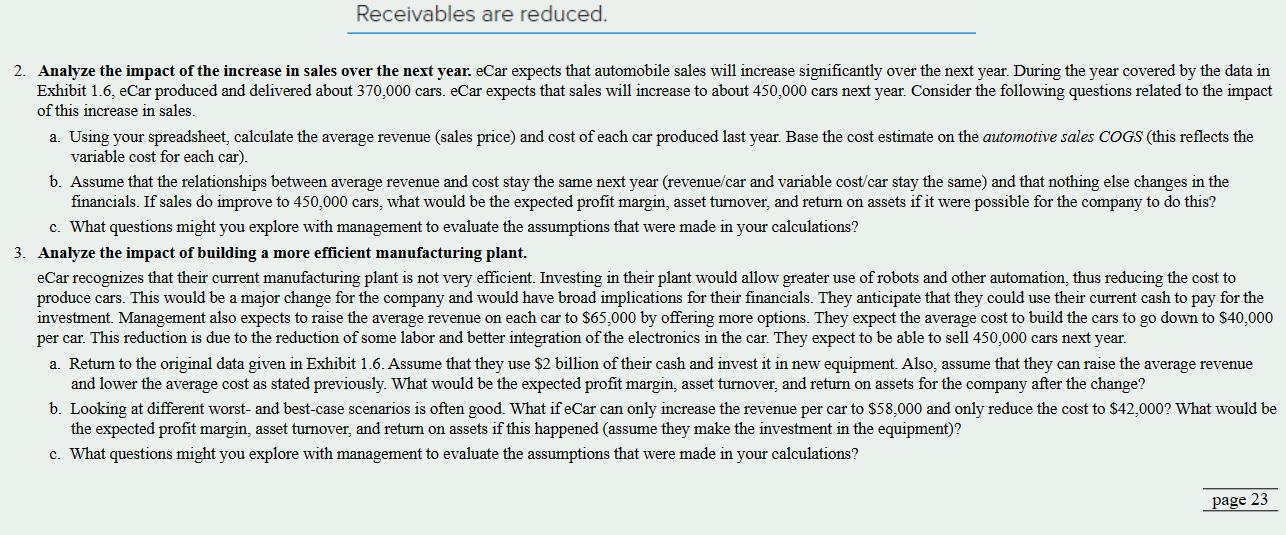
Improving a company's operations and supply chain is an ongoing job. New ways to make things, to move goods, and to interact with customers, along with a myriad of other opportunities, become available. The challenge is determining where the operations and supply chain managers should focus. Some changes will result in less objective improvements like the quality of a material finish, or a change in the shape of a product. Other improvements can be evaluated analytically such as speeding the delivery process or reducing the failure rate of a part. One uniform criterion that can be used is the financial impact of a potential improvement. This is the focus of The Supply Chain Improvement Model (SCIM). The SCIM is a mathematical version of the diagram shown in Exhibit 1.4. The model consists of a few simple linear equations that capture the relationships in the diagram. Many of these types of models are described in this book. Where possible, the equations are kept simple and intuitive so they can be easily understood and remembered. The best way to analyze a model is with a spreadsheet, since the equations can be easily captured in the formulas. The ability to evaluate the potential financial impact of an OSCM change is the goal of the SCIM. For a public company striving to improve profitability for its shareholders, the ability to predict this impact is important. Using this approach to evaluate a decision is probably not new to you, but a fresh emphasis on how OSCM influences outcomes is the purpose here. The SCIM uses base data from a company's income statement and the balance sheet. The focus here is on data that is largely dependent on OSCM functions in the firm. From the income statement: Annual sales, Labor, Material, Overhead, and Other costs (typically Sales and Administrative cost) accounts are used. From the balance sheet: Cash, Inventory, Receivables, Fixed assets (these are typically Plant, Equipment, and other assets needed to support OSCM functions), are used. The following are equations that relate these accounts: Cost of good sold = Labor + Material + Overhead Total costs = Cost of goods sold + Other costs Net income = Annual sales - Total costs Current assets = Inventory + Receivables + Cash Total assets = Current assets + Fixed assets Profit margin = Net income/Annual sales Asset turnover = Annual sales / Total assets Return on assets (ROA) = Profit margin Asset turnover The following scenario has been developed for analysis using the SCIM. The scenario uses estimates of data like what a company such as Tesla might face. Tesla, as you know, is an innovation leader in the development of electric vehicles and clean energy products. The firm manufactures electric vehicles, battery storage devices, and solar panel roof tiles. Tesla management is presented with many opportunities in their ongoing quest to lead the clean energy charge. Base Data-Setting Up the Current Financial Position of the Firm The first step in the SCIM analysis is to establish the current position of the firm. To analyze the attractiveness of changes, you must first understand how things currently look. The data used nere are a simplified version of a recent Tesla annual financial statement. As noted, this is just a starting point for the exercise. The actual scenarios developed are fictitious and for teaching purposes. It is fun to speculate what Tesla might be thinking about, and you will be encouraged to think about this later in the exercise. The current financial data for our company, eCar, are shown in Exhibit 1.6. The sales and expenses shown in the exhibit are those that relate to the operations of eCar. Our company sells and eases cars and provides other services that relate to repair and maintenance. There are other expense items reported by the company that relate to research, development, selling, and othet dministrative costs. The information shown in Exhibit 1.6 is typical of reporting required of publicly traded companies. These reports are filed both quarterly and annually and are closely followed by analysts. he reports are accompanied by extensive notes that explain the information shown in the reports. Companies are not required to report some of the details that might be of interest to an OSCM rofessional, such as direct material and labor expense. These details are summarized in the COGS entries. Of course, if you work for the company, the details will probably be available for our analysis. In the following steps, you will be asked to analyze the impact of proposed projects relative to profit margin, asset turnover, and return on investment. 1. Set up the spreadsheet with the SCIM equations. To get started, setup a spreadsheet with the data in Exhibit 1.6. In your spreadsheet, make sure to calculate the totals that are given in the exhibit. For example, Total automotive sales is the sum of Automotive sales and Automotive leasing. Further, Total sales is the sum of Total automotive sales, and Services and other. The idea is to make the spreadsheet capture potential changes in the detail accounts. So, if Automotive sales changes, the Total automotive sales and Total sales number automatically change to reflect the update. a. Using the data in Exhibit 1.6 and your spreadsheet, calculate the profit margin, asset turnover, and return on assets of the company as presented in Exhibit 1.6. (Hint: Profit page 22 margin and return on assets are negative.) b. To better understand how the SCIM works, complete the following table. Assume that the change suggested is only to the single account, and the other accounts are the same as presented in Exhibit 1.6. The change can be described in simple "up," "down," or "does not change" terms. 2. Analyze the impact of the increase in sales over the next year. eCar expects that automobile sales will increase significantly over the next year. During the year covered by the data in Exhibit 1.6, eCar produced and delivered about 370,000 cars. eCar expects that sales will increase to about 450,000 cars next year. Consider the following questions related to the impact of this increase in sales. a. Using your spreadsheet, calculate the average revenue (sales price) and cost of each car produced last year. Base the cost estimate on the automotive sales COGS (this reflects the variable cost for each car). b. Assume that the relationships between average revenue and cost stay the same next year (revenue/car and variable cost/car stay the same) and that nothing else changes in the financials. If sales do improve to 450,000 cars, what would be the expected profit margin, asset turnover, and return on assets if it were possible for the company to do this? c. What questions might you explore with management to evaluate the assumptions that were made in your calculations? 3. Analyze the impact of building a more efficient manufacturing plant. eCar recognizes that their current manufacturing plant is not very efficient. Investing in their plant would allow greater use of robots and other automation, thus reducing the cost to produce cars. This would be a major change for the company and would have broad implications for their financials. They anticipate that they could use their current cash to pay for the investment. Management also expects to raise the average revenue on each car to $65,000 by offering more options. They expect the average cost to build the cars to go down to $40,000 per car. This reduction is due to the reduction of some labor and better integration of the electronics in the car. They expect to be able to sell 450,000 cars next year. a. Return to the original data given in Exhibit 1.6. Assume that they use $2 billion of their cash and invest it in new equipment. Also, assume that they can raise the average revenue and lower the average cost as stated previously. What would be the expected profit margin, asset turnover, and return on assets for the company after the change? b. Looking at different worst- and best-case scenarios is often good. What if eCar can only increase the revenue per car to $58,000 and only reduce the cost to $42,000 ? What would be the expected profit margin, asset turnover, and return on assets if this happened (assume they make the investment in the equipment)? c. What questions might you explore with management to evaluate the assumptions that were made in your calculations
Step by Step Solution
There are 3 Steps involved in it

Get step-by-step solutions from verified subject matter experts