

Question: Can you help me answer this please ? The database summarizes nancial information for 32 companies and their perceived risk of default. Convert these data
Can you help me answer this please ?
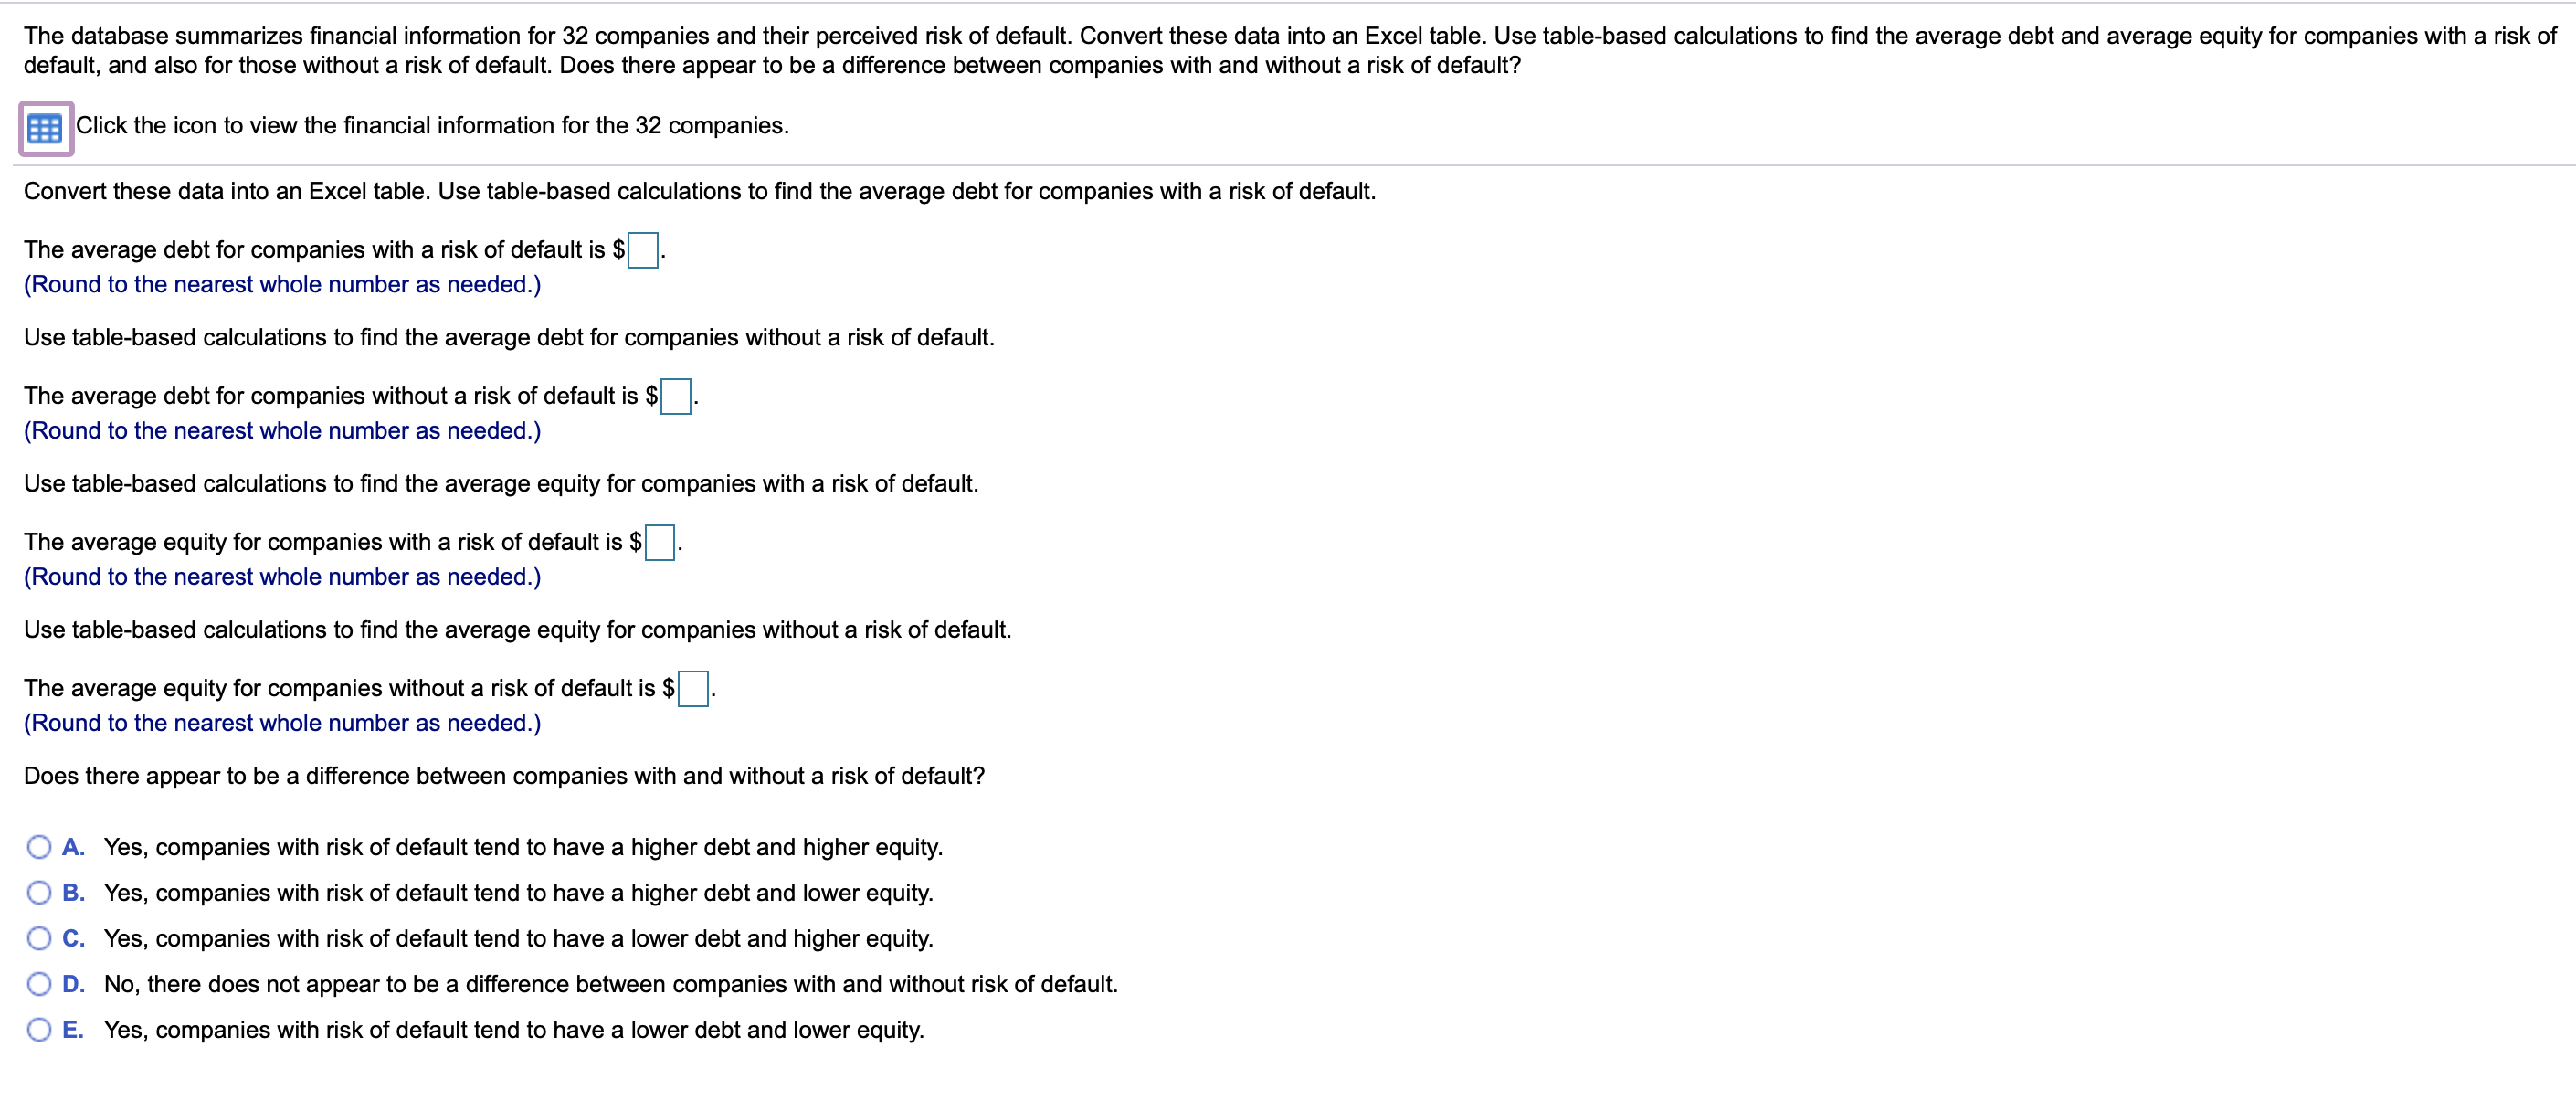
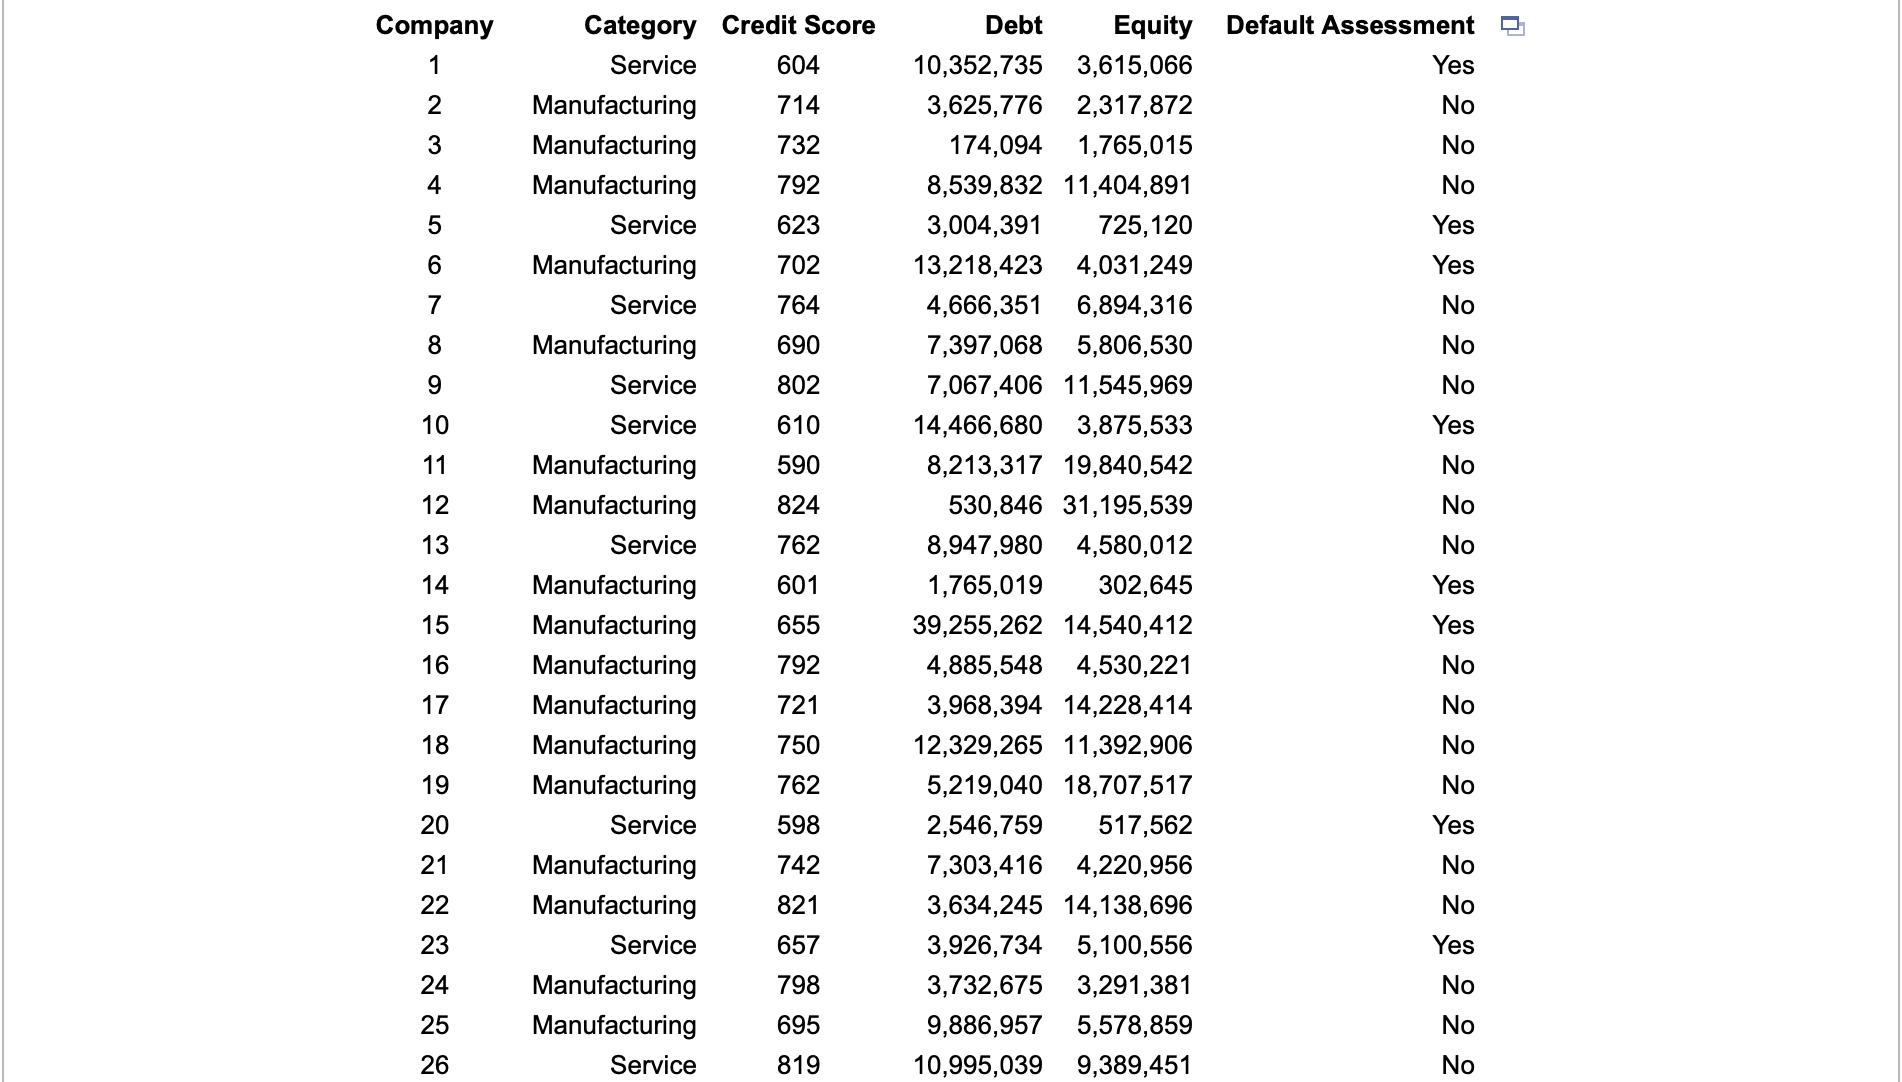

The database summarizes nancial information for 32 companies and their perceived risk of default. Convert these data into an Excel table. Use table-based calculations to nd the average debt and average equity for companies with a risk of default, and also for those without a risk of default. Does there appear to be a difference between companies with and without a risk of default? .Click the icon to view the nancial information for the 32 companies. Convert these data into an Excel table. Use table-based calculations to nd the average debt for companies with a risk of default. The average debt for companies with a risk of default is $ (Round to the nearest whole number as needed.) Use table-based calculations to nd the average debt for companies without a risk of default. The average debt for companies without a risk of default is $ (Round to the nearest whole number as needed.) Use table-based calculations to nd the average equity for companies with a risk of default. The average equity for companies with a risk of default is $ (Round to the nearest whole number as needed.) Use table-based calculations to nd the average equity for companies without a risk of default, The average equity for companies without a risk of default is $ (Round to the nearest whole number as needed.) Does there appear to be a difference between companies with and without a risk of default? O A. Yes, companies with risk of default tend to have a higher debt and higher equity. O B. Yes, companies with risk of default tend to have a higher debt and lower equity. 0 c. Yes, companies with risk of default tend to have a lower debt and higher equity. 0 D. No, there does not appear to be a difference between companies with and without risk of default. O E. Yes, companies with risk of default tend to have a lower debt and lower equity. Company Category Credit Score Debt Equity Default Assessment % 1 Service 604 10,352,735 3,615,066 Yes 2 Manufacturing 714 3,625,776 2,317,872 No 3 Manufacturing 732 174,094 1,765,015 No 4 Manufacturing 792 8,539,832 11,404,891 No 5 Service 623 3,004,391 725,120 Yes 6 Manufacturing 702 13,218,423 4,031,249 Yes 7 Service 764 4,666,351 6,894,316 No 8 Manufacturing 690 7,397,068 5,806,530 No 9 Service 802 7,067,406 11,545,969 No 10 Service 610 14,466,680 3,875,533 Yes 11 Manufacturing 590 8,213,317 19,840,542 No 12 Manufacturing 824 530,846 31,195,539 No 13 Service 762 8,947,980 4,580,012 No 14 Manufacturing 601 1,765,019 302,645 Yes 15 Manufacturing 655 39,255,262 14,540,412 Yes 16 Manufacturing 792 4,885,548 4,530,221 No 17 Manufacturing 721 3,968,394 14,228,414 No 18 Manufacturing 750 12,329,265 11,392,906 No 19 Manufacturing 762 5,219,040 18,707,517 No 20 Service 598 2,546,759 517,562 Yes 21 Manufacturing 742 7,303,416 4,220,956 No 22 Manufacturing 821 3,634,245 14,138,696 No 23 Service 657 3,926,734 5,100,556 Yes 24 Manufacturing 798 3,732,675 3,291,381 No 25 Manufacturing 695 9,886,957 5,578,859 No N 05 Service 819 10,995,039 9,389,451 No 26 27 28 29 30 31 32 Service Manufacturing Manufacturing Service Service Manufacturing Manufacturing 819 671 771 832 759 613 705 10,995,039 23,750,575 9,212,469 1 1 558,575 853,952 5,986,441 6,531 ,628 9,389,451 6,882,959 6,509,800 13,858,637 1,726,941 803,995 5,763,942 No Yes No No No Yes No
Step by Step Solution
There are 3 Steps involved in it

Get step-by-step solutions from verified subject matter experts