

Question: can you help me answer this question please? A few terms ago, I created a scatter plot to look at a possible relationship between my
can you help me answer this question please?
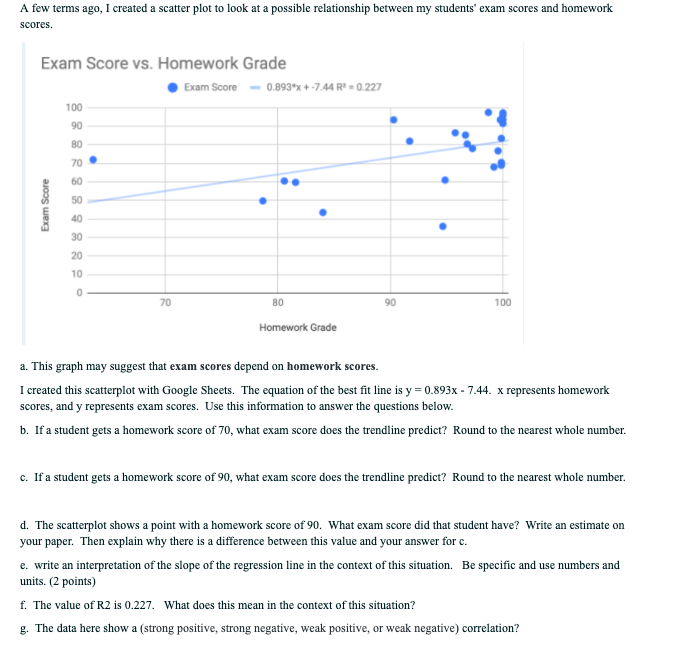
A few terms ago, I created a scatter plot to look at a possible relationship between my students' exam scores and homework scores. Exam Score vs. Homework Grade Exam Score - 0.893*x + -7.44 R' = 0.227 100 90 80 70 60 Exam Score 10 70 80 90 100 Homework Grade a. This graph may suggest that exam scores depend on homework scores. I created this scatterplot with Google Sheets. The equation of the best fit line is y = 0.893x - 7.44. x represents homework scores, and y represents exam scores. Use this information to answer the questions below. b. If a student gets a homework score of 70, what exam score does the trendline predict? Round to the nearest whole number. c. If a student gets a homework score of 90, what exam score does the trendline predict? Round to the nearest whole number. d. The scatterplot shows a point with a homework score of 90. What exam score did that student have? Write an estimate on your paper. Then explain why there is a difference between this value and your answer for c. e. write an interpretation of the slope of the regression line in the context of this situation. Be specific and use numbers and units. (2 points) f. The value of R2 is 0.227. What does this mean in the context of this situation? g. The data here show a (strong positive, strong negative, weak positive, or weak negative) correlation
Step by Step Solution
There are 3 Steps involved in it

Get step-by-step solutions from verified subject matter experts