

Question: Can you help me building and analyzing two graphs and analyze, both with the data presented below? Please, see instructions below: Growth in Grow Product
Can you help me building and analyzing two graphs and analyze, both with the data presented below? Please, see instructions below:

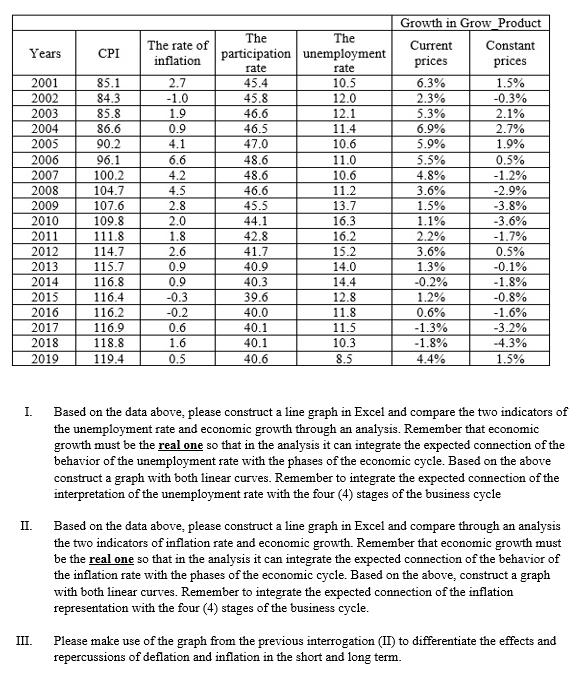
Growth in Grow Product The rate of The The Years CPI Current Constant inflation participation unemployment rate rate prices prices 2001 85.1 2.7 45.4 10.5 6.3% 2002 84.3 1.5% -1.0 45.8 12.0 2.3% 2003 0.3% 85.8 1.9 46.6 12.1 5.3% 2004 2.1% 86.6 0.9 46.5 11.4 6.9% 2005 90.2 2.7% 4.1 47.0 10.6 5.9% 2006 1.9% 96.1 6.6 48.6 11.0 5.5% 2007 0.5% 100.2 4.2 48.6 10.6 4.8% 2008 104.7 1.2% 4.5 46.6 11.2 2009 3.6% 107.6 -2.9% 2.8 45.5 13.7 2010 1.5% 109.8 -3.8% 2.0 44.1 16.3 1.1% 2011 111.8 -3.6% 1.8 42.8 16.2 2012 2.2% 114.7 1.7% 2.6 41.7 15.2 2013 115.7 3.6% 0.5% 0.9 40.9 14.0 1.3% 2014 -0.1% 116.8 0.9 40.3 14.4 0.2% 2015 -1.8% 116.4 0.3 39.6 12.8 1.2% 2016 -0.8% 116.2 -0.2 40.0 11.8 0.6% 2017 -1.6% 116.9 0.6 40.1 11.5 -1.3% 2018 118.8 -3.2% 1.6 40.1 10.3 -1.8% 2019 -4.3% 119.4 0.5 40.6 8.5 4.4% 1.5% I. Based on the data above, please construct a line graph in Excel and compare the two indicators of the unemployment rate and economic growth through an analysis. Remember that economic growth must be the real one so that in the analysis it can integrate the expected connection of the behavior of the unemployment rate with the phases of the economic cycle. Based on the above construct a graph with both linear curves. Remember to integrate the expected connection of the interpretation of the unemployment rate with the four (4) stages of the business cycle II. Based on the data above, please construct a line graph in Excel and compare through an analysis the two indicators of inflation rate and economic growth. Remember that economic growth must be the real one so that in the analysis it can integrate the expected connection of the behavior of the inflation rate with the phases of the economic cycle. Based on the above, construct a graph with both linear curves. Remember to integrate the expected connection of the inflation representation with the four (4) stages of the business cycle. III. Please make use of the graph from the previous interrogation (II) to differentiate the effects and repercussions of deflation and inflation in the short and long term
Step by Step Solution
There are 3 Steps involved in it

Get step-by-step solutions from verified subject matter experts