

Question: Can you help me complete the needed financial ratios chart (and check the ones that I did) It would be great if you could put
Can you help me complete the needed financial ratios chart (and check the ones that I did) It would be great if you could put your findings in the chart I already made. The highway averages I put in are correct, so if you would like to compare in the comment area that would be great as well. These ratios are all based on 2003.
(I will attach the statements too)
Calculation and analysis of the financial ratios: | ||||
Formula | Ratio | Highway average | Comment | |
Ratios: | ||||
Current ratio | current assets/ current liabilities | 1.77 | 1.6 to 1 | Current ratio is within the range of industry average. |
Quick ratio | quick assets/ current liabilities | 1.25 | 1.2 to 1 | Quick ratio is within the range of industry average. |
Current Liabilities to Net Worth ratio | Current liabilitieset worth | 90% | ||
Debt to equity ratio | Total liabilities/ Total equity | 1.10 | 1.3 to 1 | |
Fixed assets to net worth | Net fixed assets/ net worth | 60% to 80% | ||
Current assets to total assets | Current assets/ total assets | 0.6 | ||
Collection period | Accounts receivable x 365/ revenues | Less than 45 days | ||
Average Age of accounts payable | (Accounts payable 365)/ (Materials + Subcontract) | Less than 45 days | ||
Assets to revenues ratio | Total Assets/ Revenues | 40% to 50% | ||
Working Capital | Current Assets- Current liabilities | 10 | ||
Working Capital Turns | Revenues/ working capital | 10 | ||
Working capital turns when payments are passed to subs | Revenues- subcontractor/ working capital | 10 | ||
Accounts Payable to Revenue Ratio | Accounts payable/ revenue | 6-8% | ||
Gross Profit Margin | Gross profit/ Revenue | 22-27% | ||
General Overhead Ratio | General Overhead/ Revenue | 18% | ||
Pretax Profit Margin | Net profit before taxes/ Revenues | 4-6% | ||
After Tax Profit Margin | Net profit after taxes/ revenues | ? | NOT SURE IF THIS RATIO NEEDS TO BE DONE (if you can do it) | |
Pretax Return on Assets | Net profit before taxes/ total assets | ? | ||
After tax Return on Assets | Net profit after taxes/ total assets | ? | NOT SURE IF THIS RATIO NEEDS TO BE DONE (if you can do it) | |
Pretax Return on Equity | Net profit before taxes/equity | 15% | ||
Degree of fixed asset newness | Net fixed assets/total fixed assets | Between 60 to 40% | ||
Months in Backlog | Uncomplete Work on hand x 12/ revenues for 12 months | ? |
If you could also help fill in the rest of the guide I am using for the calculations:
Financial data for ratio analysis: | ||
2003 | 2002 | |
2002 DOESN'T NEED TO BE FILLED UNLESS NECESSARY FOR CALC | (ooo) | (ooo) |
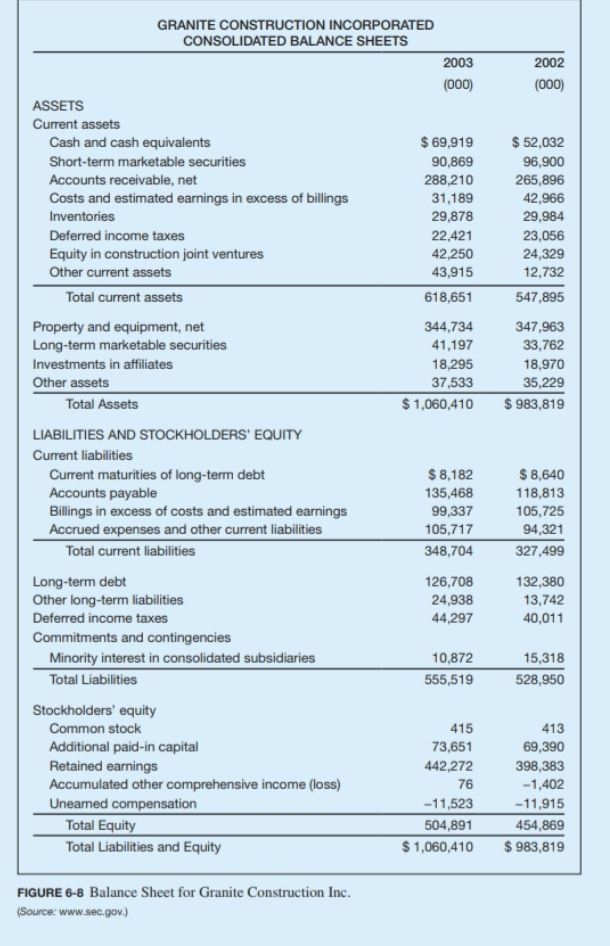
Current assets | 618,651 | 547,895 |
Total assets | 1,060,410 | 983,819 |
Current liabilities | 384,704 | 327,499 |
Total liabilities | 555,519 | 528,950 |
Total equity | 504,891 | 454,869 |
Accounts Payable | ||
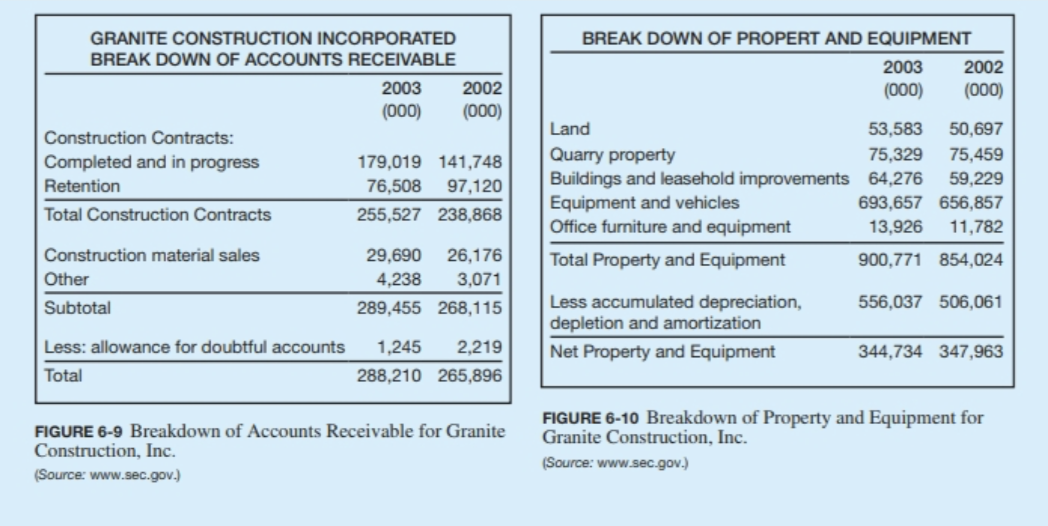
Accounts Receivable | ||
Quick assets = cash & cash equivalents + short-term marketable securities+ Accounts receivable + Costs and earnings of estimated billings CHECK | 480,187 | 457,794 |
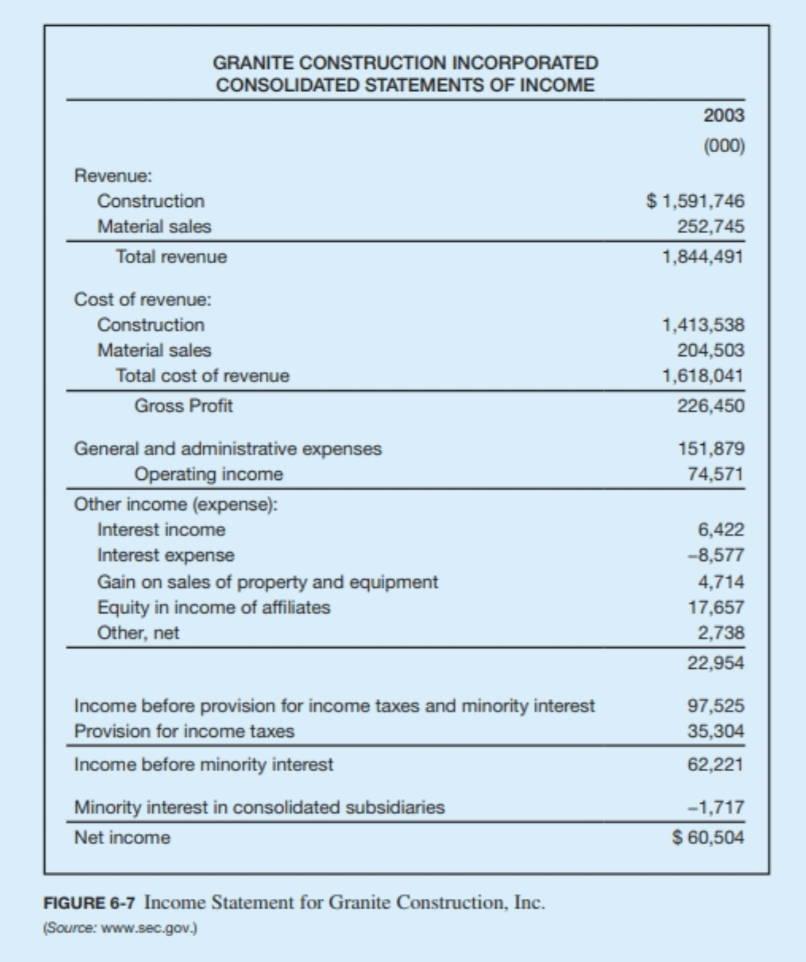
Total revenue CHECK | 184,491 | |
Gross profit CHECK | 226,450 | |
Net Worth | ||
Net Fixed Assets | ||
Materials | ||
Subcontract | ||
Working Capital | ||
General Overhead | ||
Net profit | ||
Uncomplete Work | ||
Revenue for 12 months |
Step by Step Solution
There are 3 Steps involved in it

Get step-by-step solutions from verified subject matter experts