

Question: Can you help me draw a micoreconomics model to represent this information? (economic graph model) Net broadband additions in the second quarter of 2021 were
Can you help me draw a micoreconomics model to represent this information? (economic graph model)
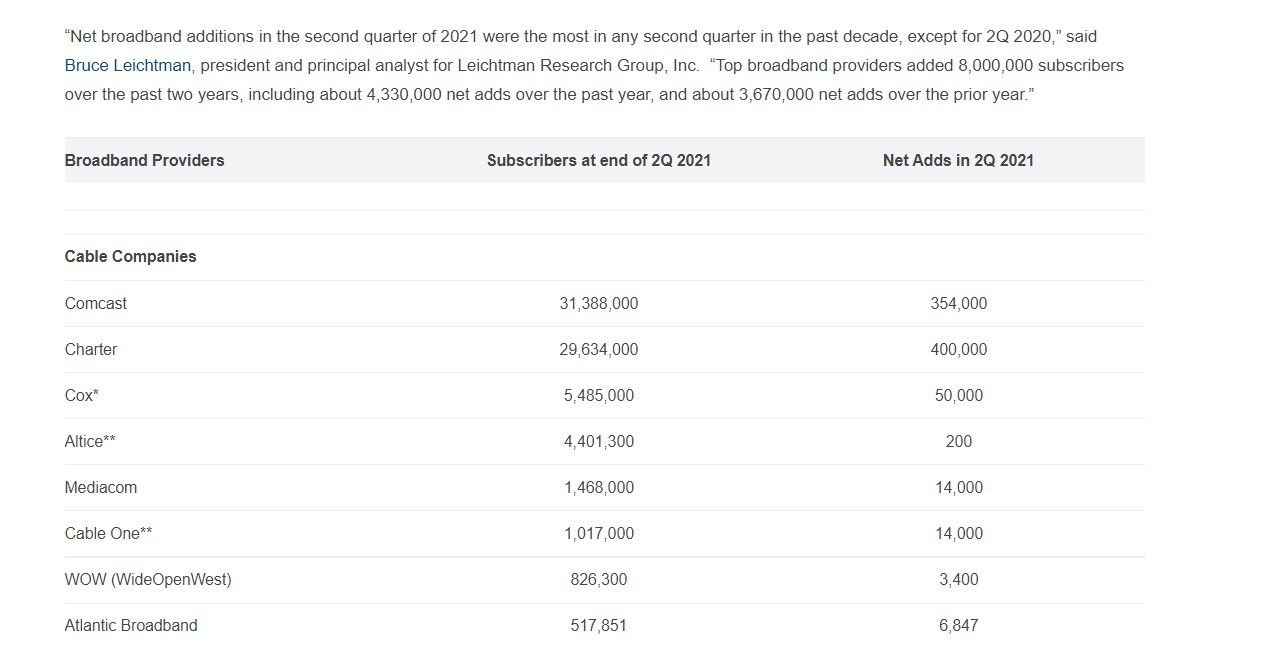
"Net broadband additions in the second quarter of 2021 were the most in any second quarter in the past decade, except for 20 2020,\" said Bruce Leichtman, president and principal analyst for Leichtrnan Research Group, Inc. \"Top broadband providers added 8,000,000 subscribers over the past two years, including about 4,330,000 net adds over the past year, and about 3,670, 000 net adds over the prior year." Broadband Providers Subscribers at end of 20 2021 Net Adds in 2Q 2021 Cable Companies Comcast 31,300,000 354,000 Charter 29,634,000 400,000 Cox' 5,435,000 50,000 Altice" 4,401,300 200 Mediacom 1,408,000 14,000 Cable One" 1,017,000 14,000 wow (WideOpenWest) 826,300 3,400 Atlantic Broadband 51?,051 6,847
Step by Step Solution
There are 3 Steps involved in it

Get step-by-step solutions from verified subject matter experts